• 2010 nasa special
    a total eclipse of the Sun is visible from within a narrow corridor that traverses Earth's southern Hemisphere. The path of the Moon's umbral shadow crosses the South Pacific Ocean where it makes no landfall except for Mangaia (Cook Islands) and Easter Island (Isla de Pascua).

Stripes are Back in Season on Jupiter

A composite of three color images of Jupiter

This image is a composite of three color images taken on Nov. 18, 2010, by the Gemini North telescope in Hawaii. Image credit: NASA/JPL/UH/NIRI/Gemini/UC Berkeley


A false-color composite image of Jupiter and its South Equatorial Belt

A false-color composite image of Jupiter and its South Equatorial Belt shows an unusually bright spot, or outbreak, in this image made from data obtained by the W.M. Keck telescope in Hawaii on Nov. 11, 2010. Image credit: NASA/JPL-Caltech/W. M. Keck Observatory/UC Berkeley


A composite of three color images of Jupiter

This image is a composite of three color images taken on Nov. 16, 2010, by NASA's Infrared Telescope Facility in Mauna Kea, Hawaii. Image credit: NASA/JPL-Caltech/IRTF/UC Berkeley

PASADENA, Calif. – New NASA images support findings that one of Jupiter's stripes that "disappeared" last spring is now showing signs of a comeback. These new observations will help scientists better understand the interaction between Jupiter's winds and cloud chemistry.

Earlier this year, amateur astronomers noticed that a longstanding dark-brown stripe, known as the South Equatorial Belt, just south of Jupiter's equator, had turned white. In early November, amateur astronomer Christopher Go of Cebu City, Philippines, saw an unusually bright spot in the white area that was once the dark stripe. This phenomenon piqued the interest of scientists at NASA's Jet Propulsion Laboratory, Pasadena, Calif., and elsewhere.

After follow-up observations in Hawaii with NASA's Infrared Telescope Facility, the W.M. Keck Observatory and the Gemini Observatory telescope, scientists now believe the vanished dark stripe is making a comeback.

First-glimpse images of the re-appearing stripe are online at:

http://www.nasa.gov/topics/solarsystem/features/jupiter20101124-i.html .

"The reason Jupiter seemed to 'lose' this band – camouflaging itself among the surrounding white bands – is that the usual downwelling winds that are dry and keep the region clear of clouds died down," said Glenn Orton, a research scientist at JPL. "One of the things we were looking for in the infrared was evidence that the darker material emerging to the west of the bright spot was actually the start of clearing in the cloud deck, and that is precisely what we saw."

This white cloud deck is made up of white ammonia ice. When the white clouds float at a higher altitude, they obscure the missing brown material, which floats at a lower altitude. Every few decades or so, the South Equatorial Belt turns completely white for perhaps one to three years, an event that has puzzled scientists for decades. This extreme change in appearance has only been seen with the South Equatorial Belt, making it unique to Jupiter and the entire solar system.

The white band wasn't the only change on the big, gaseous planet. At the same time, Jupiter's Great Red Spot became a darker red color. Orton said the color of the spot – a giant storm on Jupiter that is three times the size of Earth and a century or more old – will likely brighten a bit again as the South Equatorial Belt makes its comeback.

The South Equatorial Belt underwent a slight brightening, known as a "fade," just as NASA's New Horizons spacecraft was flying by on its way to Pluto in 2007. Then there was a rapid "revival" of its usual dark color three to four months later. The last full fade and revival was a double-header event, starting with a fade in 1989, revival in 1990, then another fade and revival in 1993. Similar fades and revivals have been captured visually and photographically back to the early 20th century, and they are likely to be a long-term phenomenon in Jupiter's atmosphere.

Scientists are particularly interested in observing this latest event because it's the first time they've been able to use modern instruments to determine the details of the chemical and dynamical changes of this phenomenon. Observing this event carefully may help to refine the scientific questions to be posed by NASA's Juno spacecraft, due to arrive at Jupiter in 2016, and a larger, proposed mission to orbit Jupiter and explore its satellite Europa after 2020.

The event also signifies another close collaboration between professional and amateur astronomers. The amateurs, located worldwide, are often well equipped with instrumentation and are able to track the rapid developments of planets in the solar system. These amateurs are collaborating with professionals to pursue further studies of the changes that are of great value to scientists and researchers everywhere.

"I was fortunate to catch the outburst," said Christopher Go, referring to the first signs that the band was coming back. "I had a meeting that evening and it went late. I caught the outburst just in time as it was rising. Had I imaged earlier, I would not have caught it," he said. Go, who also conducts in the physics department at the University of San Carlos, Cebu City, Philippines, witnessed the disappearance of the stripe earlier this year, and in 2007 he was the first to catch the stripe's return. "I was able to catch it early this time around because I knew exactly what to look for."

NASA's Exoplanet Science Institute at the California Institute of Technology in Pasadena manages time allocation on the Keck telescope for NASA. Caltech manages JPL for NASA.

For more information about NASA and agency programs, visit: http://www.nasa.gov/home .

Priscilla Vega/Jia-Rui Cook 818-354-1357/354-0850
Jet Propulsion Laboratory, Pasadena, Calif.
priscilla.r.vega@jpl.nasa.gov / Jia-Rui.C.Cook@jpl.nasa.gov

Forest Fire Smoke Plumes Probed

An instrument from the National Center for Atmospheric Research collects data from a smoke plume generated by a forest fire over Canada on July 1, 2008.


An instrument from the National Center for Atmospheric Research collects data from a smoke plume generated by a forest fire over Canada on July 1, 2008. Credit: NASA


In a nondescript room on a Canadian Air Force Base, an international team of fire trackers, weather forecasters and various atmospheric scientists puzzle over computer models, satellite tracks and flight charts. Their goal is to find the best fire targets and tailor the flight path of NASA’s airborne laboratories to track and investigate the properties of smoke plumes.

The researchers are part of the summer deployment of NASA’s Arctic Research of the Composition of the Troposphere from Aircraft and Satellites, or ARCTAS, mission. The mission is just five days into its summer study of the smoke plumes from northern latitude forest fires, and already the choreographed effort between modelers and experimenters is producing a wealth of new data.

“Given the vagaries of plume timing and location, the presence of clouds, and coordinating with satellite overpasses, the mission is coming together very well,” says Jim Crawford, manager of the Tropospheric Chemistry Program at NASA Headquarters in Washington who is on-location for the mission.

As expected in the height of fire season, Canada is turning up some fires worthy of aerial investigation. Almost daily, scientists and crew are flying from either the 4 Wing Air Force Base in Cold Lake, Alberta, on NASA’s DC-8 and P-3B aircraft, or from Yellowknife, Northwest Territories, on NASA’s B-200.

Instruments on the aircraft have sniffed the presence of smoke over Canada from distant fires in Siberia and California. But instruments are also busy sampling smoke plumes from fires originating in northern Canada, characterizing their chemical components and other physical properties. Flight paths, often adjusted on the fly to accommodate Mother Nature, have allowed scientists to collect this data from around and downwind of plumes of all sizes.

University of Toronto and Pennsylvania State University researchers prepare to launch a balloon from Yellowknife, Northwest Territories, to collect weather and ozone data.


University of Toronto and Pennsylvania State University researchers prepare to launch a balloon from Yellowknife, Northwest Territories, to collect weather and ozone data. Credit: Greg Merkes/NASA

the samples collected close to the source and downwind, researchers hope to learn how the plumes age over time. They can also examine the plume’s movement, both horizontally across the landscape and vertically into the atmosphere. Satellites have recently shown smoke plumes reaching higher into the atmosphere than previously thought possible, and now, aircraft will help confirm what satellites observed and improve future model predictions.

If models are correct, weather and fire conditions should culminate into a fury of activity on the Fourth of July, creating their own type of atmospheric “fireworks”. Specifically, researchers are hoping to spot the infamous pyrocumulus plume. Under atmospheric conditions similar to those that generate thunder storms, this type of plume can loft particles high into the upper atmosphere. The particles can then jet around the globe carried by high wind speeds and remain at altitude for an extended period, potentially impacting climate.

Shuttle's Cargo Celebrates Discovery's Distinguished History

Discovery's final voyage into orbit will carry symbols reminiscent of the great voyages of other ships by the same name.

A medallion from the Royal Society honoring legendary explorer Capt. James Cook will be carried aboard the space shuttle during STS-133. Cook's third expedition of the vast Pacific Ocean included a ship named HMS Discovery, one of the vessels shuttle Discovery is named after.

The astronauts flying Discovery during the STS-133 mission to the International Space Station don't have to be told of its significance.

"I don’t think you can take a final voyage of a ship of exploration and not take some moments to celebrate its history," said Mission Specialist Michael Barratt. "And I think many people know that our ship, Discovery, which is a ship of exploration, was named after several predecessor ships also named Discovery, all ships of exploration."

After all, Discovery has gone into orbit more than any other shuttle, or any other spacecraft for that matter. Early in its career, Discovery provided a base so astronauts could retrieve satellites, test new technologies and conduct two-week-long experiments in microgravity. NASA turned twice to Discovery for Return-to-Flight missions after accidents with shuttles Challenger and Columbia, and it launched the agency's landmark observatory, the Hubble Space Telescope.

In the last several years, Discovery has helped shuttles Atlantis and Endeavour complete the International Space Station.

Astronauts routinely carry into space mementos from schools, military units and tokens from institutions in the communities they grew up in or live in. After they come back, the crew members typically present them to the sponsoring organization or person in hopes that the item will inspire or give hope to future explorers.

In the case of the STS-133 crew, such items include a medallion from the U.S. Air Force Institute of Technology. STS-133 Commander Steve Lindsey graduated from the institute before becoming an astronaut.

Also flying on Discovery will be two small LEGO space shuttles, each with a tiny toy astronaut, to help celebrate a new educational partnership between the toy-building brick maker and NASA.

Some of the items can be off-beat. For instance, a small action figure of William Shakespeare, from the University of Texas English Department, will be a passenger on Discovery. As will a plush giraffe, the mascot of the Hermann children's hospital at the University of Texas.

While many of the items Discovery astronauts are carrying are one-of-a-kind, there are also hundreds of American and Discovery flags, mission patches and space shuttle bookmarks. As with the other commemoratives, the larger collections are meant to inspire and reward.

"Again, you can not, not celebrate the history and the heritage of this ship and we plan to continue that certainly after we land," Barratt said.

Steven Siceloff
NASA's John F. Kennedy Space Center

Demanding Design Boosts Shuttle Engine

Space shuttle main engines lined up at KSC

Space shuttle main engines stand lined up in the Space Shuttle Main Engine Processing Facility at NASA's Kennedy Space Center. Known at Kennedy as "the engine shop," the facility is the high-tech work area for engineers and technicians who inspect and ready the engines for launch. Photo credit: NASA/Steven Siceloff


Technician works on space shuttle main engine.

A technician examines a space shuttle main engine as it sits in a workstand. The top part of the engine is called the "powerhead" and it is the section of the machinery that houses turbopumps and the ductwork needed to generate the thrust to lift the space shuttle into orbit. Photo credit: NASA/Jack Pfaller


A space shuttle main engine fires in test stand.

A space shuttle main engine undergoes a test firing inside a test stand at NASA's Stennis Space Center in Mississippi. Note that frost has formed on the outside of the engine nozzle even as 6,000 degree exhaust erupts from inside. Photo credit: NASA


Close-up of space shuttle main engines during launch.

A close-up of space shuttle Atlantis' three main engines as they help power the shuttle into space. The exhaust from the engines is going Mach 10, which results in the "shock diamonds" from the three engines. Because the engine burns hydrogen and oxygen, its exhaust is steam. Photo credit: NASA/Rusty Backer and Michael Gayle


An SSME standing up

A space shuttle main engine stands alone. Technicians have rotating devices to position the engines for processing. Photo credit: NASA/Jack Pfaller


A space shuttle main engine burns at 6,000 degrees F, but the outside of the nozzle remains cool to the touch. Prior to launch, sometimes it even frosts over.

The nozzle technology that allows a finger-width of ridged metal to contain and steer flames that would boil iron is just one of the scores of innovations designers came up with for the engines three decades ago.

Such advances were critical if NASA was going to realize its plans for a reusable space shuttle that, unlike the previous rockets, would not use its engines once and then drop them in the ocean.

Some of the others:
- A system that lets the engines be incrementally throttled up and down depending on the needs of the mission
- A hydrogen turbopump that spins 567 times a second with each 2” tall turbine blade generating 700 horsepower.
- A computer that runs 50 health checks on the engine every second using data from 200 sensors
- A system of pipes, or ducts, that withstand pressures as high as 7,000 pounds per square inch
- A main combustion chamber strong enough to contain the explosion of 970 pounds of oxygen and 162 pounds of hydrogen fuel every second, continuously for 8 1/2 minutes
- The only heavy-lift booster engine that continuously performs all the way from launch pad to orbit
- Engineering and materials that allow the engine to be reused multiple times
- A compact, efficient design that produces 8 times the thrust of a modern high performance jet engine per each pound of weight.

Added together, the innovations became a rocket engine that is more than 99.9 percent efficient, which means that almost all of its hydrogen and oxygen is used to create thrust. For comparison, an automobile engine is about a third as efficient, since most of its energy is created in the form of heat that does not turn the wheels.

"Everything in that engine is a whole science field," said Carlos Estrada, NASA's Main Propulsion Branch chief at Kennedy Space Center. "You look at the materials, you look at the components, you look at the way they designed that engine, how it's all designed for the different stages with the pump and pressures. I mean, every time you look at a component you have all these people with expertise in it."

Three main engines are used to launch a shuttle into orbit, along with help from a pair of solid-fueled boosters that separate two minutes after launch.

The advances did not come easily for designers who, working in the 1970s before computer-assisted design became commonplace, ran many of their calculations on slide rules and used judgments based on the experience they gained building massive engines for the Saturn V moon rocket.

Getting the start sequence correct alone took about a year of testing, fixing and more testing, said Dan Hausman, Pratt & Whitney Rocketdyne's site director at Kennedy. "We kept burning up the turbine blades, getting temperature spikes. Our analog models weren't that good with the start sequence. We had to figure out how to get it started because everything had an idiosyncrasy."

The idiosyncrasies he talks about are no small matter considering a single main engine creates more than four times the horsepower of the Hoover Dam.

When most people think of an engine, they usually picture a part of the engine called a bell or nozzle. It's the part that everyone sees at launch shooting flames and supersonic exhaust. Although a lot is happening inside the bell, it's one of the least active parts of the machine during launch. The real action is taking place in front of the engine bell in a maze of hidden machinery called the powerhead.

"The powerhead is the meat of the engine," said Stephen Prescott, a Pratt & Whitney Rocketdyne engineer specializing in the engine's turbopumps. "The nozzle is what's actually allowing us to gather the thrust, but the powerhead is what actually gives us the thrust."

The powerhead is home to four turbopumps, a robust computer controller and a network of ducts, wiring and valves designed to release 500,000 pounds of thrust without exploding. For as much power as it releases, the powerhead is not imposingly large. Standing above the nozzle in a workstand, the powerhead reaches about six feet from the floor. The high-pressure hydrogen turbopump, the strongest of the four, would fit on a desk.

"You run into some people who think it's easy," Hausman said. "Anybody who thinks it's easy doesn't understand it. Once you understand it, that's a marvel of engineering. It's a marvel that people can build it, and operate it and work it at the high reliability that we've done."

The first space shuttle main engine ignition took place well before Columbia lifted off on April 12, 1981, to inaugurate the space shuttle era. It happened in the mid-1970s at a concrete and steel test stand at NASA's Stennis Space Center in Mississippi where engineers and designers could put an engine through its paces without worrying about sacrificing a spacecraft and its payload if something went wrong.

And things went wrong, especially in the beginning. The liquid oxygen turbopump blew up. The hydrogen turbopump blades broke and exploded the whole thing. There was the occasional combustion instability, which is a polite way of saying the controlled exhaust thrust went out of control and, you guessed it, blew the engine up.

In fact, the first engine test Hausman saw in person at Stennis ended with a puff of black smoke and half the engine sitting at the bottom of the stand.

"There wasn't much left, it was all kind of a molten mass of dripping metal because when liquid oxygen eats metal, there's no evidence left because metal vaporizes," Hausman explained. "Twenty milliseconds, 40 milliseconds, 60 milliseconds, the engine's gone. Very fast."

It is that speed that keeps the shuttle engine's mechanics on their toes as they carefully evaluate every engine after a flight.

"We have a line from John Plowden, one our most senior engineers, that’s embedded in the DNA of everyone here: Never turn your back on a rocket engine," Prescott said. "Knowing what this engine can do to itself in a split second is what keeps us focused on knowing you can't just brush off something that you think is fine."

While spectacular malfunctions on the engines were a mark of the early part of the engine development, fixing them effectively and retesting over and over would become a hallmark of the main engine program.

"The key was test, test, test," Hausman said. "In the development program, the best learning we could ever do was have an engine blow up at Stennis, because we could find an issue and go fix it."

"Any part that flew here at Kennedy had a counterpart that operated twice as long at Stennis," Hausman said.

Stennis recorded 2,000 main engine test firings between 1975 and 1992. More firings, including flight certification tests for every engine used on a shuttle, took place until July 29, 2009, bringing the total to over 2,300 engine firings at that one facility.

Hausman credits the careful development work with setting up the engine to successfully cope with problems during a shuttle launch, though there were very few of those throughout the shuttle's 130-plus missions.

A shuttle mission has never failed because of the main engines, though there were a couple close calls. The first came in 1985, when one of Challenger's three main engines shut down during ascent, prompting the crew to fly to a lower orbit. The Spacelab mission still was successful and engineers traced the problem to one of the sensors on the engine that shut down.

A series of failures occurred during the launch of Columbia in 1999, when a pin broke loose inside the main combustion chamber and popped a couple tiny holes in three of the 1,080 hydrogen tubes in the nozzle. There also was a pair of short circuits in Columbia’s electrical system during ascent which resulted in a loss of electrical power on the primary channel to the engines. The redundant safety features designed into the engine allowed the controller to seamlessly transfer control to an alternate channel and continue on with the mission.

Eileen Collins commanded the flight and Columbia was able to reach orbit and deploy the groundbreaking Chandra X-ray observatory just as was planned.

Prescott was watching that launch and listening to the transmissions back and forth between controllers and the shuttle crew.

"We knew something had gone on, but we weren't quite sure just what had happened," Prescott said. "Eileen, that was the most perfect example of what kind of training those astronauts go through, because she was just so calm, cool and collected."

Engineers dove deeply into the engine after Columbia's return to find out what went wrong.

"That was pretty scary," Estrada said. "That was a big deal."

Another engine safety feature was demonstrated during Columbia’s third mission in 1982 when one of the orbiter’s three auxiliary power units shut down late into the launch, resulting in a loss of hydraulic power to one main engine. That engine’s backup electrical control system maintained control and performance until reaching orbit which was then followed by a fail-safe, pneumatically-actuated main engine cut-off.

Hausman said the redundant systems built into the engines paid off during those situations.

A great deal of effort and research went into developing the shuttle's main engines, but maintaining them and keeping them healthy during the shuttle's 30-year career has been equally advanced and careful.

"I came in around 1996, and to me it was amazing to see how much people needed to know to be able to manage such a piece of equipment," Estrada said.

The engines' overseers spend hours peering with one eye shut into a small borescope, basically a long, black, flexible fiber optic hose with a lens at one end and an eyepiece at the other. Doctors use them frequently to examine patients. The engineers are looking for anything amiss, whether it be a weld in one of the turbopump housings, a tiny hole in a pipe, unusual wear or erosion or something they've never seen before.

"Keeping the discipline of what you do and how you do it is critical," Estrada said.

It is repetitive and painstaking work that takes a full shift to complete on each major component of the engine. And that does not count all the other extensive inspections performed before an engine launches again.

"Pretty much everything on this engine is criticality one," Prescott said. "We can’t even so much as lose a fastener and not create a problem because we're pretty close to the limits on everything on this engine."

When the technicians find something amiss, no effort is too much to track it down and fix it.

"It's a three-dimensional puzzle that sometimes, like a Rubik's Cube, you don't even know you’re close to getting it together until all the sudden, the thing's solved in front of you," Prescott said. "We've been known to chase our tails trying to get just perfect alignment and before you know it, there it is, everything can go together."

Throughout the shuttle's operation, designers kept improving the machinery. The sensors were steadily improved to make them more robust, the powerhead was redesigned to reduce pressures inside the transfer tubes and smooth the fuel flow, and the main combustion chamber throat area was enlarged to de-rate the engine and add extra operating margin. The modified heat exchanger eliminated welds and was strengthened.

Perhaps one of the biggest changes came when additional robustness was designed into the high pressure turbo-machinery. Overall, these design changes resulted in an additional 700 pounds of weight, but increased safety by a factor of 3 over earlier configurations. A final engine upgrade was introduced in 2007 when the advanced health management system became active, providing an additional 23 percent safety improvement during ascent.

Why put so much effort into the engines? Hausman credits rocket pioneer and Saturn V developer Werner von Braun with detailing the argument:

"The gist of his discussion was, if you don't build the engine right, anything above it that you put your time and money in is a waste of your time because if you don't build this right, you're not getting into space," Hausman said.

Steven Siceloff
NASA's John F. Kennedy Space Center

Space Shuttle Mission: STS-133

Technicians apply foam to the external tank.

Image above: Technicians spray foam insulation on a section of repaired stringers on space shuttle
Discovery's external fuel tank. Photo credit:

During space shuttle Discovery's final spaceflight, the STS-133 crew members will take important spare parts to the International Space Station along with the Express Logistics Carrier-4. Discovery has been moved to Launch Pad 39A at NASA's Kennedy Space Center in Florida.

Discovery Powered Down, Analysis Continue

At NASA's Kennedy Space Center in Florida, space shuttle Discovery is powered down for the weekend while analysis continue. Discovery's launch is currently targeted for no earlier than Dec. 17, after shuttle managers determined more tests and analysis are needed.

The Program Requirements Control Board reviewed on Wednesday repairs and engineering evaluations associated with cracks on two 21-foot-long, U-shaped aluminum brackets, called stringers, on the shuttle's external tank. Managers decided the analysis and tests required to launch Discovery safely are not complete. The work will continue through next week.

The next status review by the PRCB will be Thursday, Dec. 2. If managers clear Discovery for launch on Dec. 17, the preferred time is about 8:51 p.m. EST.

Lori B. Garver, NASA Deputy Administrator

Deputy Administrator Lori B. Garver. Credit: NASA/Bill Ingalls

Lori Garver, NASA Deputy Administrator. Credit: NASA/Bill Ingalls

Nominated by President Barack Obama and confirmed by the U.S. Senate, Lori Beth Garver began her duties as the deputy administrator of the National Aeronautics and Space Administration on July 17, 2009.

As deputy administrator, Garver is NASA's second in command. She works closely with the administrator to provide overall leadership, planning, and policy direction for the agency. Together with the NASA administrator, Garver represents NASA to the Executive Office of the President, Congress, heads of government agencies, international organizations, and external organizations and communities. She also oversees the work of NASA’s functional offices, including the Office of the Chief Financial Officer, Office of Communications, and the newly-formed Mission Support Directorate.

Garver's confirmation as deputy administrator marks the second time she has worked for NASA. Her first period of service to the agency was from 1996 to 2001. She first served as a special assistant to the NASA administrator and senior policy analyst for the Office of Policy and Plans, before becoming the associate administrator for the Office of Policy and Plans. Reporting to the NASA administrator, she oversaw the analysis, development and integration of policies and long-range plans, the NASA Strategic Management System, and the NASA Advisory Council.

A native of Michigan, Garver graduated from Haslett High School in Haslett, Michigan, in 1979 and four years later, in 1983, she earned a bachelor's degree in political science and economics from Colorado College. Her focus turned to space when she accepted a job working for Sen. John Glenn from 1983 to 1984. She since has served in a variety of senior roles in the nonprofit, government and commercial sectors.

Garver worked at the newly formed National Space Society from 1984 to 1996, becoming its second executive director in 1987. She served as the society's primary spokesperson, making frequent appearances on national television and regularly testifying on Capitol Hill. During that time, she also earned a master's degree in science, technology and public policy from George Washington University in 1989.

After working at NASA from 1996 to 2001, Garver was employed as the vice president of DFI Corporate Services from 2001 to 2003. From January 2001 until her nomination as NASA's deputy administrator, she was a full-time consultant as the president of Capital Space, LLC, and senior advisor for space at the Avascent Group. In these roles, she provided strategic planning, technology feasibility research and business development assistance, as well as merger, acquisition and strategic alliance support, to financial institutions and Fortune 500 companies.

Garver was the lead civil space policy advisor for the 2008 Obama presidential campaign and led the agency review team for NASA during the post-election transition. Previously, she served as the lead space policy advisor for the Hillary Clinton and John Kerry campaigns for president and represented them at various events and conferences. Garver has held numerous senior positions in space policy. She was a member of the NASA Advisory Council, a guest lecturer at the International Space University, president and board member of Women in Aerospace, and president of the American Astronautical Society. She lives in Virginia with her husband, David Brandt, and their sons Wesley and Mitchell.

Expedition 25 Landing


The Soyuz TMA-19 spacecraft with Expedition 25 Commander Doug Wheelock and Flight Engineers Shannon Walker and Fyodor Yurchikhin touches down near the town of Arkalyk, Kazakhstan on Friday, Nov. 26, 2010. Russian Cosmonaut Yurchikhin and NASA Astronauts Wheelock and Walker, are returning from six months onboard the International Space Station where they served as members of the Expedition 24 and 25 crews.

Beginning the Upgrade

I guess I need to start out by posting a photo of the ice runway from McMurdo Station as this didn’t get into the last post. It is located a few miles from McMurdo, operates from October to December until the sea ice begins to break up.


The last couple of days on Ice (slang: The Ice refers to any place and every place in Antarctica) the team spent pulling old equipment out of racks, packing the equipment for return to the US as well as populating the racks with the new equipment. The majority of ground station equipment in our operations on the 1st floor of the Joint Space Operations Center (JSOC) building and building 71 below the radome will be shipped back to Wallops Flight Facility for reuse or excess property disposal. A good deal of materials ( being sorted for recycling—NSF’s recycling program is a topic for a later post. The pictures below provide a couple different views of the radome, building 71 and the JSOC.

The MGS radome, building 71, and McMurdo Station down below on the left

The radome as seen from town

The JSOC

The entrance to the NASA area

HTSI/William Kambarn (left) and LJT/Chuck Bradford perform manlift battery maintenance inside the radome

All of our cargo has either been received at McMurdo, except scaffolding and replacement radome panels. They are in transit in New Zealand. Depending on the nature of the cargo it was shipped by an air freight or cargo vessel from Port Hueneme, CA where the NSF logistics hub in the US is located, to New Zealand. Any items that can’t be stored outside, such are electronics, are marked Do Not Freeze (DNF) and are temporarily stored in warm storage until they can be delivered and quickly unpacked.

Unpacking DNF crates with ground station electronics outside the JSOC

Sort of like Christmas morning inside the JSOC

HTSI/James Evans (left) and 567/Mike Mahon installing new equipment in the JSOC

Operation IceBridge Completes Another Successful Antarctic Campaign

From: Michael Studinger, IceBridge project scientist, Goddard Earth Science and Technology Center at the University of Maryland


SANTIAGO, Chile -- For the first time in six weeks the nose of the DC-8 is pointing north today after taking off from Punta Arenas airport. Instead of heading south on our familiar flight path to Antarctica over snow capped mountains that soon mark the last land before the windswept Southern Ocean, we are heading north towards Santiago, where we will stay overnight and continue on to Palmdale, California on the next day. We have completed our science flights over Antarctica and are heading home.

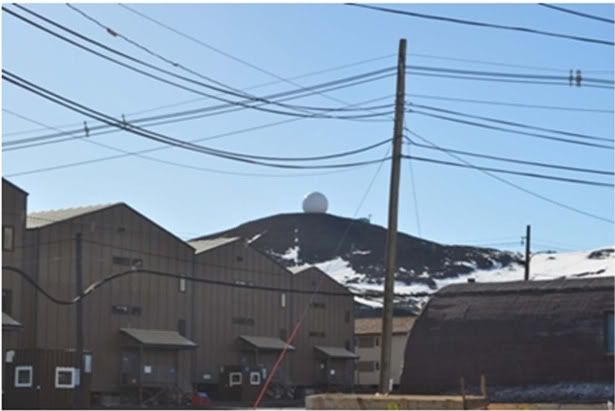
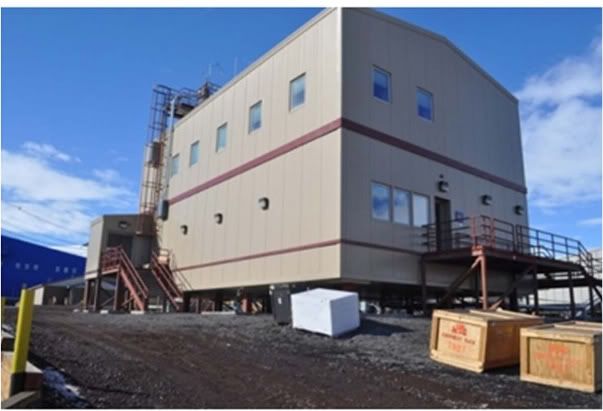
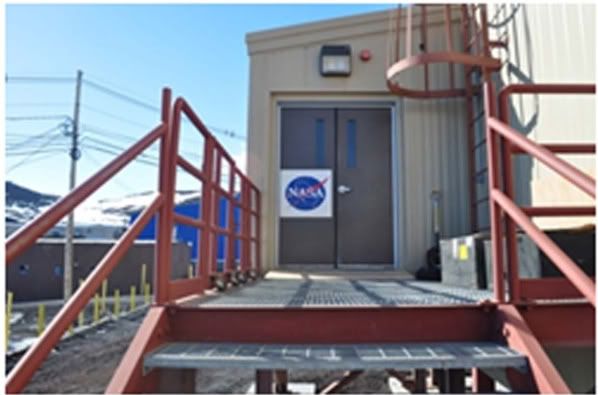
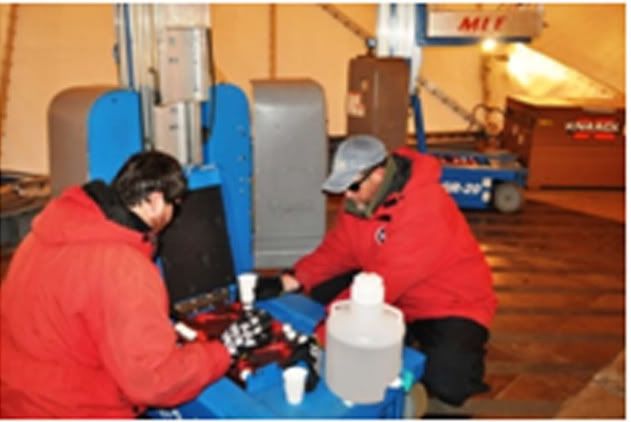
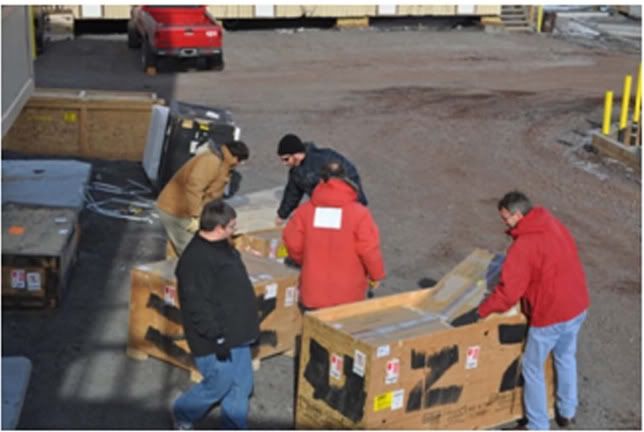
We had a very successful campaign and accomplished many things although it was challenging at times. Worse than normal weather over the Antarctic Peninsula and Marie Byrd Land and aircraft downtimes slowed down our progress during the deployment. By adapting our plans to the situation we were able to fly 10 successful missions making use of 84% of the allocated science flight hours. The IceBridge teams have spent 115 hours in the air collecting data and have flown 40,098 nautical miles, almost twice around the Earth. We collected landmark sea ice data sets in the Weddell,

Bellingshausen and Amundsen Seas. We have now flown over every ICESat orbit ever flown by completing an arc at 86°S, the inflection point of all ICESat orbits around the South Pole. We have surveyed many glaciers along the Antarctic Peninsula, the Pine Island Glacier area and in Marie Byrd Land. We have collected data along a sea ice transit at the same time ESA’s CryoSat-2 satellite flew overhead allowing us to calibrate and validate the satellite measurements.


We are fortunate to have the best equipment and tools for our research. The NASA DC-8 aircraft is ideally suited for our challenging missions in an extreme environment. The science instruments on the aircraft are cutting edge with unique capabilities. But it is the people of IceBridge that make the success of IceBridge, not the instruments or the aircraft. I would like to thank everyone involved in this campaign, at home or in the field, who with their dedication, experience, and skills make IceBridge a success. We also depend on many people and organizations who support our missions.

The list is long but the following deserve a special thank you: our Chilean friends from the Centro de Estudios Científicos, the personnel of the Dirección General de Aeronáutica Civil at the Punta Arenas airport, the Armada de Chile, the Universidad de Magallanes, the U.S. Embassy in Santiago, the CryoSat-2 teams from the European Space Agency, the National Science Foundation’s Office of Polar Programs, the British Antarctic Survey, UNAVCO, the AMPS weather forecast team, and last but not least the staff at the hotel Diego de Almagro in Punta Arenas. Thank you all!

We are looking forward to returning to Punta Arenas next year for another IceBridge campaign over Antarctica. Meanwhile check this blog for our upcoming campaign over Greenland and the Arctic Ocean with NASA’s P-3B aircraft in March 2011.

Qinetiq wins NASA deal worth $2bn

UK DEFENCE technology group Qinetiq has won a multi-year engineering contract with US Space Agency NASA worth up to $2bn (£1.25bn).

Qinetiq’s US arm will provide engineering support and ground operations to the Kennedy Space Centre in Florida from March 2011, although contract terms are still being finalised.

The deal is for at least five years, with options for a further three, and is worth up to $2bn (£1.25bn).

Profit margins will be at the lower end of Qinetiq’s range due to the size and quality of the contract.

The work is expected to include designing and developing ground systems and equipment for NASA launch vehicles and spacecraft and technology for NASA mission requirements and operations, among others.

Qinetiq shares closed up by 1.25 per cent at 113.70p as investors welcomed the news, which comes at a time of government spending cuts on both sides of the Atlantic.

The UK Ministry of Defence budget has been cut by eight per cent in real terms over the next four years while the US recently cancelled NASA’s $108bn Constellation manned space programme to get astronauts to the Moon by 2020 and Mars by 2030.

Qinetiq shares fell by more than a third in October after it lost a major MoD army, navy and air force training contract, but rallied last week as it announced a 14 per cent rise in 2010 first half profits.

The group employs about 6,000 people in the UK and has staff in most US states.

It was forced to issue two profit warnings in November 2009 and January 2010 due to delays in UK and US government contract decisions.

Middle school students to hear directly from astronauts in space

Washington (CNN) -- A group of Washington middle school students are about to get a science lesson that is truly out of this world.

Students from Hart Middle School and Deal Middle School will participate in a (very) long-distance call with astronauts Scott Kelly, Shannon Walker and Doug Wheelock on Tuesday.

The astronauts, residents of the orbiting International Space Station, are conducting science experiments aboard the space station for about six months.

NASA Associate Administrator for Education Leland Melvin and U.S. Secretary of Education Arne Duncan will join the students to discuss living and working in space with the International Space Station crew, NASA said

"The live, in-flight education downlink is one of a series with educational organizations in the U.S. and abroad to improve teaching and learning in science, technology, engineering and mathematics," NASA's website states.

The live event is hosted by NASA and the U.S. Department of Education, NASA said. It was developed with the help of Teach for America educators at the two middle schools.

The transmission is scheduled for 11:20 to 11:40 a.m. ET and will air live on NASA Television and on the agency's website.

Doublers' Installed on Tank Stringers


  • Technicians at NASA's Kennedy Space Center in Florida installed new sections of metal, called "doublers" because they are twice as thick as the original stringer metal, to replace the two cracked stringers on space shuttle Discovery's external fuel tank. Caps at the end of the stringers will be installed this morning. Primer application for the replacement foam insulation also will begin this morning.


    At yesterday’s Program Requirements Control Board, or PRCB, the Space Shuttle Program clearly identified the analysis and repairs that are required to safely launch shuttle Discovery on its STS-133 mission. This analysis will be reviewed at a special PRCB on Wednesday, Nov. 24. Pending a successful review of the flight rationale at that meeting, a Launch Status Briefing would be held with senior NASA management on Monday, Nov. 29.

    The Launch Status Briefing and news conference planned for Monday, Nov. 22 are cancelled. The Kennedy Space Center “Call-to-Stations” to begin the launch countdown will be no earlier than Nov. 30, supporting a first launch attempt no earlier than Dec. 3 at about 2:52 a.m. EST.

  • Space Shuttle Mission: STS-133

    Technicians connect the vent line to the GUCP.


    above: On Launch Pad 39A at NASA's Kennedy Space Center in Florida, technicians reattach the vent line to the ground umbilical carrier plate, or GUCP, on space shuttle Discovery's external fuel tank. Photo credit: NASA/Ben Smegelsky

    'Yankee Clipper' Crater on Mars (Stereo)


    Texas House members set to take over key committees, possibly dashing New York's space shuttle bid Read more: http://www.nydailynews.com/ny_local/201

    If new House members from Texas have their way, space shuttle fleet will be landing in their home state - not New York.

    Rothstein/EPA
    If new House members from Texas have their way, space shuttle fleet will be landing in their home state - not New York.
    WASHINGTON - New York City's odds of snagging a retired NASA space shuttle for the Intrepid Sea-Air-Space Museum just got way longer in an uphill fight with Texas.

    Don't-mess-with-Texas types are set to take over key House committees with huge sway over NASA's budget, and they've made clear where they want any or all of the three retiring shuttles - Atlantis, Discovery and Endeavour - to go.

    "East Texas, West Texas, Northeast Texas and even the 4th District of Texas, even the Panhandle, would make excellent homes for the orbiter fleet," said 87-year-old Rep. Ralph Hall (R-Tex.), the oldest member of Congress.

    Rep. Pete Olson (R-Tex.) said, "It should come as no surprise to anyone that I believe the people of Houston in particular have earned the right to house one of the orbiters, and every member of the Texas congressional delegation agrees with me."

    Hall and Olson made the arguments in September, when they teamed up with the powerful Florida delegation in trying to muscle New York out of the bidding.

    The main competition to the Intrepid came from the Johnson Space Center in Houston and the Kennedy Space Center in Florida, but more than 15 other museums nationwide also have put in bids.

    The Smithsonian National Air and Space museum in Washington is considered a lock for one of the ships, leaving the other locales to battle it out for the other two.

    Sen. Kirsten Gillibrand (D-N.Y.) shoehorned language into a recent NASA bill to keep the Intrepid in the bidding, but Hall and Olson will have more heft in the new Congress that starts in January.

    Hall will take over as chairman of the House Science and Technology Committee, while Olson takes the reins of the space subcommittee.

    Gillibrand isn't giving up without a fight.

    "With all due respect, real geographic diversity requires NASA to look beyond the Texas border" to find homes for the shuttles, the senator said.

    "More than 50 million people each year would have the chance to see the shuttle in New York City, making the Big Apple the best choice," Gillibrand added.

    More than 155,000 visitors to the Intrepid have signed petitions asking NASA for a shuttle to grace the flight deck of the decommissioned aircraft carrier floating off the West Side. The museum has begun raising money for the $28.8 million NASA wants to transport the orbiter.

    NASA Administrator Charles Bolden, a retired Marine general and astronaut, initially set April 2011 as the date for deciding where the shuttles will spend retirement. But delays in the remaining two shuttle flights could push back Bolden's ruling.

    NASA: Space Shuttle Discovery Launch Pushed to December 3

    NASA logo

    The launch of the Space Shuttle Discovery will happen no earlier than December 3, NASA announced Friday.

    If conditions are adequate, the shuttle will depart at 2:52am Eastern time that day, the agency said. Technicians have been working to repair cracks and a hydrogen leak that pushed a planned November 5 launch to at least November 30. That has now been extended an additional three days. NASA's Program Requirements Control Board (PRCB) will review those repairs at a November 24 meeting, and if everything is on track, a launch status briefing with senior NASA management will be held on November 29.

    In examining the shuttle, cracks have been uncovered on the its stringers, which are 21-foot-long support beams. On Friday, NASA said technicians "installed new sections of metal, called 'doublers' because they are twice as thick as the original stringer metal, to replace the two cracked stringers on space shuttle Discovery's external fuel tank."

    Discovery Shuttle crack

    "Caps at the end of the stringers will be installed this morning," NASA continued. "Primer application for the replacement foam insulation also will begin this morning." Click right for a larger image of the crack in the foam.

    Leaks and weather issues delayed the shuttle launch several times earlier this month. The shuttle was initially scheduled to launch on Monday, November 1, but helium and nitrogen leaks in the pressurization portion of space shuttle pushed that to Tuesday. When repairs related to those leaks lasted longer than expected, NASA again delayed the launch to Wednesday. Electrical issues prevented launch on that day, however, while the Cape Canaveral weather marred a Thursday launch. They hydrogen gas leak and cracks found on Friday, meanwhile, then required technicians to delay the launch until at least November 30.

    NASA reschedules shuttle Discovery launch date again

    NASA has announced that the launch of its space shuttle Discovery has been delayed once more, until 3 December.

    The US space agency had previously postponed the much-troubled launch until the end of November, following the diagnosis of a hydrogen gas leak in one of the external fuel tanks, as well as poor weather preceding the discovery of the leak.
    Technical repairs

    That date has now been put back by three days, which NASA believes will give it time to correctly fix the leak and also allow technicians to review the repairs.

    If conditions are adequate, Discovery will launch no later than 2.52am Eastern Standard Time.

    Discovery was to shuttle NASA’s robotic astronaut, Robonaut 2, to the International Space Station along with other supplies during its original launch.

    Shane Hulgraine

    Climate Variability

    The ocean is a significant influence on Earth's weather and climate. The ocean covers 70% of the global surface. This great reservoir continuously exchanges heat, moisture, and carbon with the atmosphere, driving our weather patterns and influencing the slow, subtle changes in our climate. The oceans influence climate by absorbing solar radiationand releasing heat needed to drive the atmospheric circulation, by releasing aerosols that influence cloud cover, by emitting most of the water that falls on land as rain, by absorbing carbon dioxide from the atmosphereand storing it for years to millions of years.

    The oceans absorb much of the solar energy that reaches earth, and thanks to the high heat capacity of water, the oceans can slowly release heat over many months or years. The oceans store more heat in the uppermost 3 meters (10 feet) that the entire atmosphere, the key to understanding global climate change is inextricably linked to the ocean. Climate is influenced by storage of heat and CARBON DIOXIDE in the ocean, which depends on both physical and biological processes.

    Let's look at some of these processes. At the end of the last ice age, about 15,000 years ago, and the ice sheets melted away and climate warmed at that time. Ice sheets began to grow, and climate cool about 130,000 years ago at the beginning of the last ice age. About 130,000 years ago, fed by evaporation of ocean waters, the polar ice caps thickened and expanded Earth cooled by almost 12° C and global sea level to drop 130m below its current level. About 15,000 years ago, this process was reversed as more sunlight reached areas near the Arctic Circle, and Earth emerged from the ice age. Earth is about 8° Celsius (14° Fahrenheit) warmer today than it was then.

    Still recovering from the ice age, global sea level continues to rise. The past century alone has seen global temperature increase by 0.6 degree Celsius (1 degree Fahrenheit), and the average global sea level over the past decade has risen steadily. Is this just part of the natural cycle? How much of this warming is due to the burning of fossil fuels? Is human nature affecting Mother Nature? What should we do? Our response to the challenge of global warming begins by formulating the right set of questions. The first step in addressing the issue of global warming is to recognize that the warming pattern, if it continues, will probably not be uniform.

    The term "global warming" only tells part of the story; our attention should be focused on "global climate change." The real threat may not be the gradual rise in global temperature and sea level, but the redistribution of heat over the Earth's surface. Some spots will warm, while others will cool; these changes, and the accompanying shifts in rainfall patterns, could relocate agricultural regions across the planet. By studying the oceans from space, we can unlock a vast store of information about our changing environment.

    climate pyramid

    This diagram shows the relationship between physical and biological oceanography and climate variability. Heat transport and ocean circulation are key factors between physical oceanography and climate variability. Biological oceanography impacts climate through the biological pump. Together, air-sea gas fluzes and penetrative solar radiation are feedbacks between physical and biological oceanography processes that ultimately influence climate.

    Climate is effected by both the biological and physical processes of the oceans. In addition, physical and biological processes affect each other creating a complex system. Both the ocean and the atmosphere transport roughly equal amounts of heat from Earth's equatorial regions - which are intensely heated by the Sun - toward the icy poles, which receive relatively little solar radiation. The atmosphere transports heat through a complex, worldwide pattern of winds; blowing across the sea surface, these winds drive corresponding patterns of ocean currents. But the ocean currents move more slowly than the winds, and have much higher heat storage capacity.


    The winds drive ocean circulation transporting warm water to the poles along the sea surface. As the water flows poleward, it releases heat into the atmosphere. In the far North Atlantic, some water sinks to the ocean floor. This water is eventually brought to the surface in many regions by mixing in the ocean, completing the oceanic conveyor belt (see below). Changes in the distribution of heat within the belt are measured on time scales from tens to hundreds of years. While variations close to the ocean surface may induce relatively short-term climate changes, long-term changes in the deep ocean may not be detected for many generations. The ocean is the thermal memory of the climate system.

    • Physical characteristics of heat transport and ocean circulation impact the Earth's climate system. Like a massive 'flywheel' that stabilizes the speed of an engine, the vast amounts of heat in the oceans stabilizes the temperature of Earth. The heat capacity of the ocean is much greater than that of the atmosphere or the land. As a result, the ocean slowly warms in the summer, keeping air cool, and it slowly cools in winter, keeping the air warm. A coastal city like San Francisco has a small range of temperature throughout the year, but a mid-continental city like Fargo, ND has a very wide range of temperatures. The ocean carries substantial heat only to the sub-tropics. Poleward of the sub-tropics, the atmosphere carries most of the heat.
    • Climate is also influenced by the "biological pump," a biological process in the ocean that impacts concentrations of carbon dioxide in the atmosphere. The oceanic biological productivity is both a source and sink of carbon dioxide, one of the greenhouse gases that control climate. The "biological pump" happens when phytoplankton convert carbon dioxide and nutrients into carbohydrates (reduced carbon). A little of this carbon sinks to the sea floor, where it is buried in the sediments. It stays buried for perhaps millions of years. Oil is just reduced carbon trapped in sediments from millions of years ago. Through photosynthesis, microscopic plants (phytoplankton) assimilate carbon dioxide and nutrients (e.g., nitrate, phosphate, and silicate) into organic carbon (carbohydrates and protein) and release oxygen.
    • Carbon dioxide is also transferred through the air-sea interface. Deep water of the ocean can store carbon dioxide for centuries. Carbon dioxide dissolves in cold water at high latitudes, and is subducted with the water. It stays in the deeper ocean for years to centuries before the water is mixed back to the surface and warmed by the sun. The warm water releases carbon dioxide back to the atmosphere. Thus the conveyor belt described below carries carbon dioxide into the deep ocean. Some (but not all, or even a large part) of this water comes to the surface in the tropical Pacific perhaps 1000 years later, releasing carbon dioxide stored for that period. The physical temperature of the ocean helps regulate the amount of carbon dioxide is released or absorbed into the water. Cold water can dissolve more carbon dioxide than warm water. Temperature of ocean is also impacted the biological pump. Penetrative solar radiation warms the ocean surface causing more carbon dioxide to be released into the atmosphere. Oceanic processes of air-sea gas fluxes effect biological production and consequentially impacting climate. But as plant growth increases, the water gets cloudy and prevents the solar radiation from penetrating beneath the ocean surface.

    NASA Oceanography & Climate

    NASA satellite observations of the oceans of the past three decades have improved our understanding of global climate change by making global measurements needed for modeling the ocean-atmosphere climate system. NASA uses several instruments to get sea-surface temperature (AVHRR or other), height (altimeter), winds (scatterometers), productivity (MODIS), and salinity (future instruments). Global data sets available on time scales of days to years (and, looking ahead, to decades) have been and will be a vital resource for scientists and policy makers in a wide range of fields. Ocean surface topography and currents, vector winds (both speed and direction), sea-surface temperature, and salinity are the critical variables for understanding the ocean-climate connection.

    Sea Winds

    Scatterometers are used to measure vector winds. The SeaWinds scatterometer has provided scientists with the most detailed, continuous global view of ocean-surface winds to date, including the detailed structure of hurricanes, wide-driven circulation, and changes in the polar sea-ice masses. Scatterometer signals can penetrate through clouds and haze to measure conditions at the ocean surface, making them the only proven satellite instruments capable of measuring vector winds at sea level day and night, in nearly all weather conditions. Combined with data from Topex/Poseidon, Jason-1, and weather satellites, moorings and drifters, data from SeaWinds and its follow-on missions will be used to study long-term change. Earth's weather patterns such as El Niño, and the Northern Oscillation, which affect the hydrologic and bio-geochemical balance of the ocean-atmosphere system.

    QuickScat seawinds

    The SeaWinds scatterometer aboard NASA's QuikSCAT satellite collected the data used to create this multicolored image of winds on the surface of the Pacific Ocean. This image taken on Jan. 8, 2004, shows near-surface winds 10 meters above the ocean surface. QuikScat carries the SeaWinds scatterometer, a specialized microwave radar that measures near-surface wind speed and direction under all weather and cloud conditions over the Earth's oceans. In recent years, the ability to detect and track severe storms has been dramatically enhanced by the advent of weather satellites.

    Data from the SeaWinds scatterometer is augmenting traditional satellite images of clouds by providing direct measurements of surface winds to compare with the observed cloud patterns in an effort to better determine a hurricane's location, direction, structure, and strength. Specifically, these wind data are helping meteorologists to more accurately identify the extent of gale-force winds associated with a storm, while supplying inputs to numerical models that provide advanced warning of high waves and flooding.
    Credit: QuikSCAT team at NASA's Jet Propulsion Laboratory.

    Ocean Surface Topography

    Radar altimeters like those on the Topex/Poseidon and Jason missions, are used to measure ocean surface topography. Bouncing radio waves off the ocean surface and timing their return with incredible accuracy, these instruments tell us the distance from the satellite to the sea surface within a few centimeters - the equivalent of sensing the thickness of a dime from a jet flying at 35,000 feet! At the same time, special tracking systems on the satellites give their position relative to the center of mass of Earth also with an accuracy of a few centimeters. By subtracting the height of the satellite above the sea from the height of the satellite above the center of mass, scientists calculate maps of the sea-surface height and changes in the height due to tides, changing currents, heat stored inthe ocean, and amount of water in the ocean. By mapping the topography of the ocean we can determine the speed and direction of ocean currents. Just as wind blows around high- and low-pressure centers in the atmosphere, water flows around the high and lows of the ocean surface.

    Jason-1 image of Hurrican Isabel
    TOPEX/Poseidon & Jason-1 View of Hurricane Isabel September 27, 2003. As Hurricane Isabel slammed into the North Carolina Coast this month, TOPEX/Poseidon and Jason-1 orbited calmly overhead. This is a false color illustration of wave height off the east coast of the United Stated on September 15, 2003 shows a significant increase in wave height to over 5 meters beneath Hurricane Isabel.
    Credit: NASA JPL

    Maps of sea-surface height are most useful when they are converted to topographic maps. To determine topography of the sea-surface, height maps are compared with a gravitational reference map that shows the hills and valleys of a motionless ocean due to variations in the pull of gravity. The GRACE (Gravity Recovery and Climate Experiment) mission will provide very accurate maps of gravity that will allow us to greatly improve our knowledge of ocean circulation. GRACE has provided gravity measurements that are up to 100 times more accurate than previous values. This improved accuracy will lead the way to break-throughs in our understanding of ocean circulation and heat transport. Two animations showing sea surface height (SSH) and sea surface temperature (SST) Anomalies in the Pacific Ocean from October 1992 to August 2002. The increase in temperature and height in the equatorial region west of South America illustrates the 1997-98 El Nino event.

    SSH and SST animation
    Sea-surface height is shown relative to normal with normal shown as green. Blue and purple areas represent heights measuring between 8 and 24 centimeters (3 and 9 inches) lower than normal. Red and white areas represent higher than normal sea-surface heights and indicate warmer water. These areas are between 8 and 24 centimeters, (3 and 9 inches) higher than normal.
    Credit: NASA JPL

    Temperature & Salinity

    Water is an enormously efficient heat-sink. Solar heat absorbed by bodies of water during the day, or in the summer, is released at night, or in winter. But the heat in the ocean is also circulating. Temperature & Salinity control the sinking of surface water to the deep ocean, which affects long-term climate change. Such sinking is also a principal mechanism by which the oceans store and transport heat and carbon dioxide. Together, temperature and salinity differences drive a global circulation within the ocean sometimes called the Global Conveyor Belt.

    Global Conveyor Belt
    "The Global Conveyer Belt for Heat" represents in a simple way how ocean currents carry warm surface waters from the equator toward the poles and moderate global climate. This global circuit takes up to 1,000 years to complete. This illustration shows the generalized model of this thermohaline circulation: 'Global Conveyor Belt.' Cold deep high salinity currents circulating from the north Atlantic Ocean to the southern Atlantic Ocean and east to the Indian Ocean. Deep water returns to the surface in the Indian and Pacific Oceans through the process of upwelling. The warm shallow current then returns west past the Indian Ocean, round South Africa and up to the North Atlantic where the water becomes saltier and colder and sinks starting the process all over again.

    The heat in the water is carried to higher latitudes by ocean currents where it is released into the atmosphere. Water chilled by colder temperatures at high latitudes contracts (thus gets more dense). In some regions where the water is also very salty, such as the far North Atlantic, the water becomes dense enough to sink to the bottom. Mixing in the deep ocean due to winds and tides brings the cold water back to the surface everywhere around the ocean. Some reaches the surface via the global ocean water circulation conveyor belt to complete the cycle. During this circulation of cold and warm water, carbon dioxide is also transported. Cold water absorbs carbon dioxide from the atmosphere, and some sinks deep into the ocean. When deep water comes to the surface in the tropics, it is warmed, and the carbon dioxide is released back to the atmosphere. Salinity can be as important as temperature in determining density of seawater in some regions such as the western tropical Pacific and the far North Atlantic. Rain reduces the salinity, especially in regions of very heavy rain. Some tropical areas get 3,000 to 5,000 millimters of rain each year. Evaporation increases salinity because as evaporation occurs, salt is left behind thus making surface water denser. Evaporation in the tropics averages 2,000 millimeters per year. This denser saltier water sinks into the ocean contributing to the global circulation patterns and mixing. Ocean salinity measurements have been few and infrequent, and in many places salinity has remained unmeasured. Remotely sensed salinity measurements hold the promise of greatly improving our ocean models. This is the challenge of project Aquarius, a NASA mission scheduled to launch in 2008, which will enable us to further refine our understanding of the ocean-climate connection.

    Global Biosphere
    The above image shows the global biosphere. The Normalized Difference Vegetation Index (NDVI) measures the amount and health of plants on land, while chlorophyll a measurements indicate the amount of phytoplankton in the ocean. Land vegetation and phytoplankton both consume atmospheric carbon dioxide. This global biosphere image reveals amount of land vegetation in addition to amounts of phytoplankton. High amounts of phytoplankton are observed in the mid to high latitudes and along the west coast of North Africa and east coast of China.
    Credit: SeaWiFS Project, NASA/Goddard Space Flight Center, and ORBIMAGE
    Net Primary Productivity
    This false-color map represents the Earth's carbon "metabolism"-the rate at which plants absorbed carbon out of the atmosphere. The map shows the global, annual average of the net productivity of vegetation on land and in the ocean during 2002. The yellow and red areas show the highest rates, ranging from 2 to 3 kilograms of carbon taken in per square meter per year. The green, blue, and purple shades show progressively lower productivity.
    Credit: NASA Goddard Space Flight Center

    The Biological Pump

    Life in the ocean consumes and releases large quantities of carbon dioxide. Across Earth's oceans, tiny marine plants called phytoplankton use chlorophyll to capture sunlight during photosynthesis and use the energy to produce sugars. Phytoplankton are the basis of the ocean food web, and they play a significant role in Earth's climate, since they draw down carbon dioxide, a greenhouse gas, at the same rate as land plants. About half of the oxygen we breathe arises from photosynthesis in the ocean.

    Because of their role in the ocean's biological productivity and their impact on climate, scientists want to know how much phytoplankton the oceans contain, where they are located, how their distribution is changing with time, and how much photosynthesis they perform. They gather this information by using satellites to observe chlorophyll as an indicator of the number, or biomass, of phytoplankton cells.

    Probably the most important and predominant pigment in the ocean is chlorophyll-α contained in microscopic marine plants known as phytoplankton. Chlorophyll-α absorbs blue and red light and reflects green light. If the ratio of blue to green is low for an area of the ocean surface, then there is more phytoplankton present. This relationship works over a very wide range of concentrations, from less than 0.01 ton early 50 milligrams of chlorophyll per cubic meter of seawater.