During the year 2010, two solar and two lunar eclipses occur as follows:
Predictions for the eclipses are summarized in Figures 1, 2, 3, and 4. World maps show the regions of visibility for each eclipse. The lunar eclipse diagrams also include the path of the Moon through Earth's shadows. Contact times for each principal phase are tabulated along with the magnitudes and geocentric coordinates of the Sun and Moon at greatest eclipse.
All times and dates used in this publication are in Universal Time or UT. This astronomically derived time system is colloquially referred to as Greenwich Mean Time or GMT. To learn more about UT and how to convert UT to your own local time, see Time Zones and Universal Time.
The first solar eclipse of 2010 occurs at the Moon's ascending node in western Sagittarius. An annular eclipse will be visible from a 300-km-wide track that traverses central Africa, the Indian Ocean and eastern Asia (Espenak and Anderson, 2008). A partial eclipse is seen within the much broader path of the Moon's penumbral shadow, which includes eastern Europe, most of Africa, Asia, and Indonesia (Figure 1).
The annular path begins in westernmost Central African Republic at 05:14 UT. Because the Moon passes through apogee two days later (Jan 17 at 01:41 UT), its large distance from Earth produces an unusually wide path of annularity. Traveling eastward, the shadow quickly sweeps through Uganda, Kenya, and southern Somalia while the central line duration of annularity grows from 7 to 9 minutes.
For the next two hours, the antumbra crosses the Indian Ocean, its course slowly curving from east-southeast to northeast. The instant of greatest eclipse [1] occurs at 07:06:33 UT when the eclipse magnitude [2] will reach 0.9190. At this instant, the duration of annularity is 11 minutes 8 seconds, the path width is 333 kilometers and the Sun is 66° above the flat horizon formed by the open ocean. Such a long annular duration will not be exceeded for over 1000 years (3043 Dec 23).
The central track continues northeast where it finally encounters land in the Maldive Islands (07:26 UT). The capital city Male experiences an annular phase lasting 10 minutes 45 seconds This is the longest duration of any city having an international airport in the eclipse track.
When the antumbra reaches Asia the central line passes directly between the southern tip of India and northern Sri Lanka (07:51 UT). Both regions lie within the path where maximum annularity lasts 10 minutes 15 seconds Quickly sweeping over the Bay of Bengal the shadow reaches Burma where the central line duration is 8 minutes 48 seconds and the Sun's altitude is 34°.
By 08:41 UT, the central line enters China. The shadow crosses the Himalayas through Yunnan and Sichuan provinces Chongqing lies directly on the central line and witnesses a duration of 7 minutes 50 seconds with the Sun 15° above the horizon. Racing through parts of Shaanxi and Hubei provinces, the antumbra's speed increases as the duration decreases. In its final moments, the antumbra travels down the Shandong Peninsula and leaves Earth's surface (08:59 UT).
During the course of its 3 3/4-hour trajectory, the antumbra's track is approximately 12,900 km long that covers 0.87% of Earth's surface area. Path coordinates and central line circumstances are presented in Table 1.
Partial phases of the eclipse are visible primarily from Africa, Asia and Indonesia. Local circumstances for a number of cities are found in Table 2. All times are given in Universal Time. The Sun's altitude and azimuth, the eclipse magnitude and obscuration3 are all given at the instant of maximum eclipse.
This is the 23rd eclipse of Saros 141 (Espenak and Meeus, 2006). The family began with a series of 6 partial eclipses starting on 1613 May 19. The first annular eclipse took place on 1739 Aug 04 and had a maximum duration just under 4 minutes. Subsequent members of Saros 141 were all annular eclipses with increasing durations, the maximum of which was reached on 1955 Dec 14 and lasted 12 minutes 9 seconds. This event was the longest annular eclipse of the entire Second Millennium. The duration of annularity of each succeeding eclipse is now dropping and will dwindle to 1 minute 9 seconds when the last annular eclipse of the series occurs on 2460 Oct 14. Saros 141 terminates on 2857 Jun 13 after a long string of 22 partial eclipses. Complete details for the 70 eclipses in the series (29 partial and 41 annular) may be found at:
eclipse.gsfc.nasa.gov/SEsaros/SEsaros141.html
Complete details including many tables, maps and weather prospects can be found in the NASA 2010 eclipse bulletin (Espenak and Anderson, 2008) and online at:
eclipse.gsfc.nasa.gov/SEmono/ASE2010/ASE2010.html
Finally, a web-based zoomable map of the 2010 annular eclipse path is available plotted on Google maps at:
eclipse.gsfc.nasa.gov/SEgoogle/SEgoogle2001/SE2010Jan15Agoogle.html
The first lunar eclipse of 2010 occurs at the Moon's ascending node in western Sagittarius about 3° east of the Lagoon Nebula (M8). It is visible from much of the Americas, the Pacific and eastern Asia (Figure 2). The Moon's contact times with Earth's shadows are listed below.
Penumbral Eclipse Begins:   08:57:21 UT
Partial Eclipse Begins:     10:16:57 UT
Greatest Eclipse:           11:38:27 UT
Partial Eclipse Ends:       12:59:50 UT
Penumbral Eclipse Ends:     14:19:34 UT
At the instant of greatest eclipse4 the umbral eclipse magnitude5 will reach 0.5368. At that time the Moon will be at the zenith for observers in the South Pacific. In spite of the fact that barely half of the Moon enters the umbral shadow (the Moon's northern limb dips 16.2 arc-minutes into the umbra), the partial phase still lasts 2 2/3 hours.
Figure 2 shows the path of the Moon through the penumbra and umbra as well as a map of Earth showing the regions of eclipse visibility. New England and eastern Canada will miss the entire eclipse since the event begins after moonset from those regions. Observers in western Canada and the USA will have the best views with moonset occurring sometime after mid-eclipse. To catch the entire event, one must be located in the Pacific or eastern Australia.
Table 3 lists predicted umbral immersion and emersion times for 15 well-defined lunar craters. The timing of craters is useful in determining the atmospheric enlargement of Earth's shadow (see Crater Timings During Lunar Eclipses).
The June 26 partial lunar eclipse belongs to Saros 120, a series of 83 eclipses in the following sequence: 21 penumbral, 7 partial, 25 total, 7 partial, and 23 penumbral lunar eclipses (Espenak and Meeus, 2009). Complete details for the series can be found at:
eclipse.gsfc.nasa.gov/LEsaros/LEsaros120.html
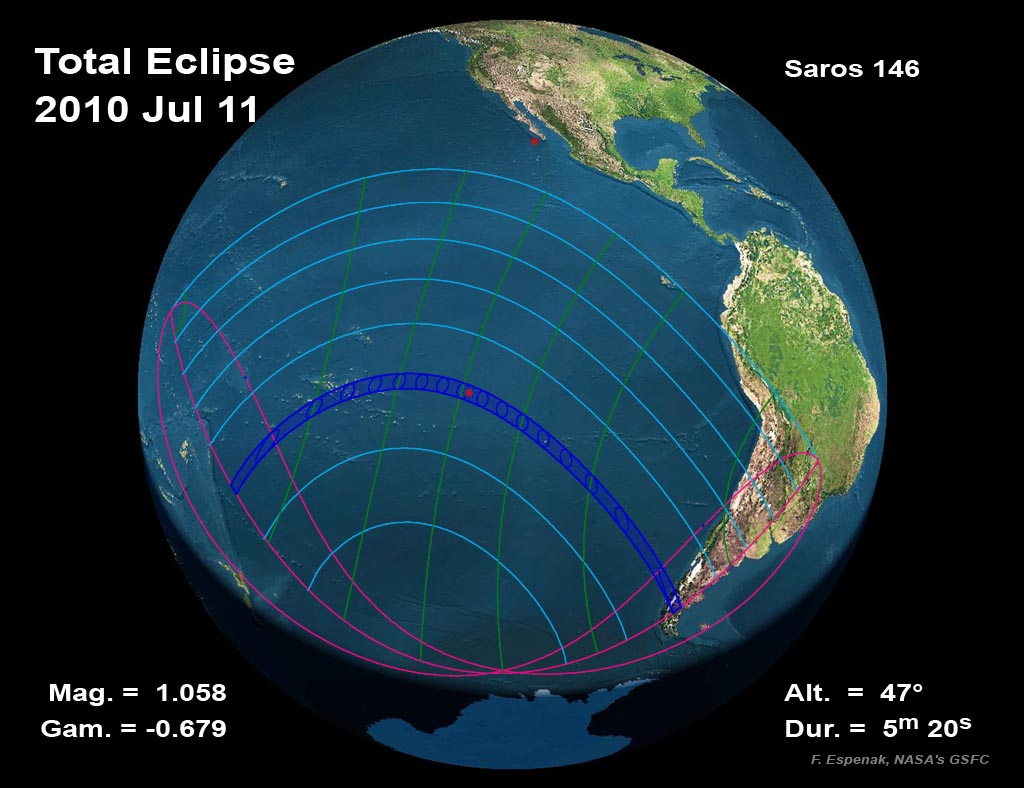
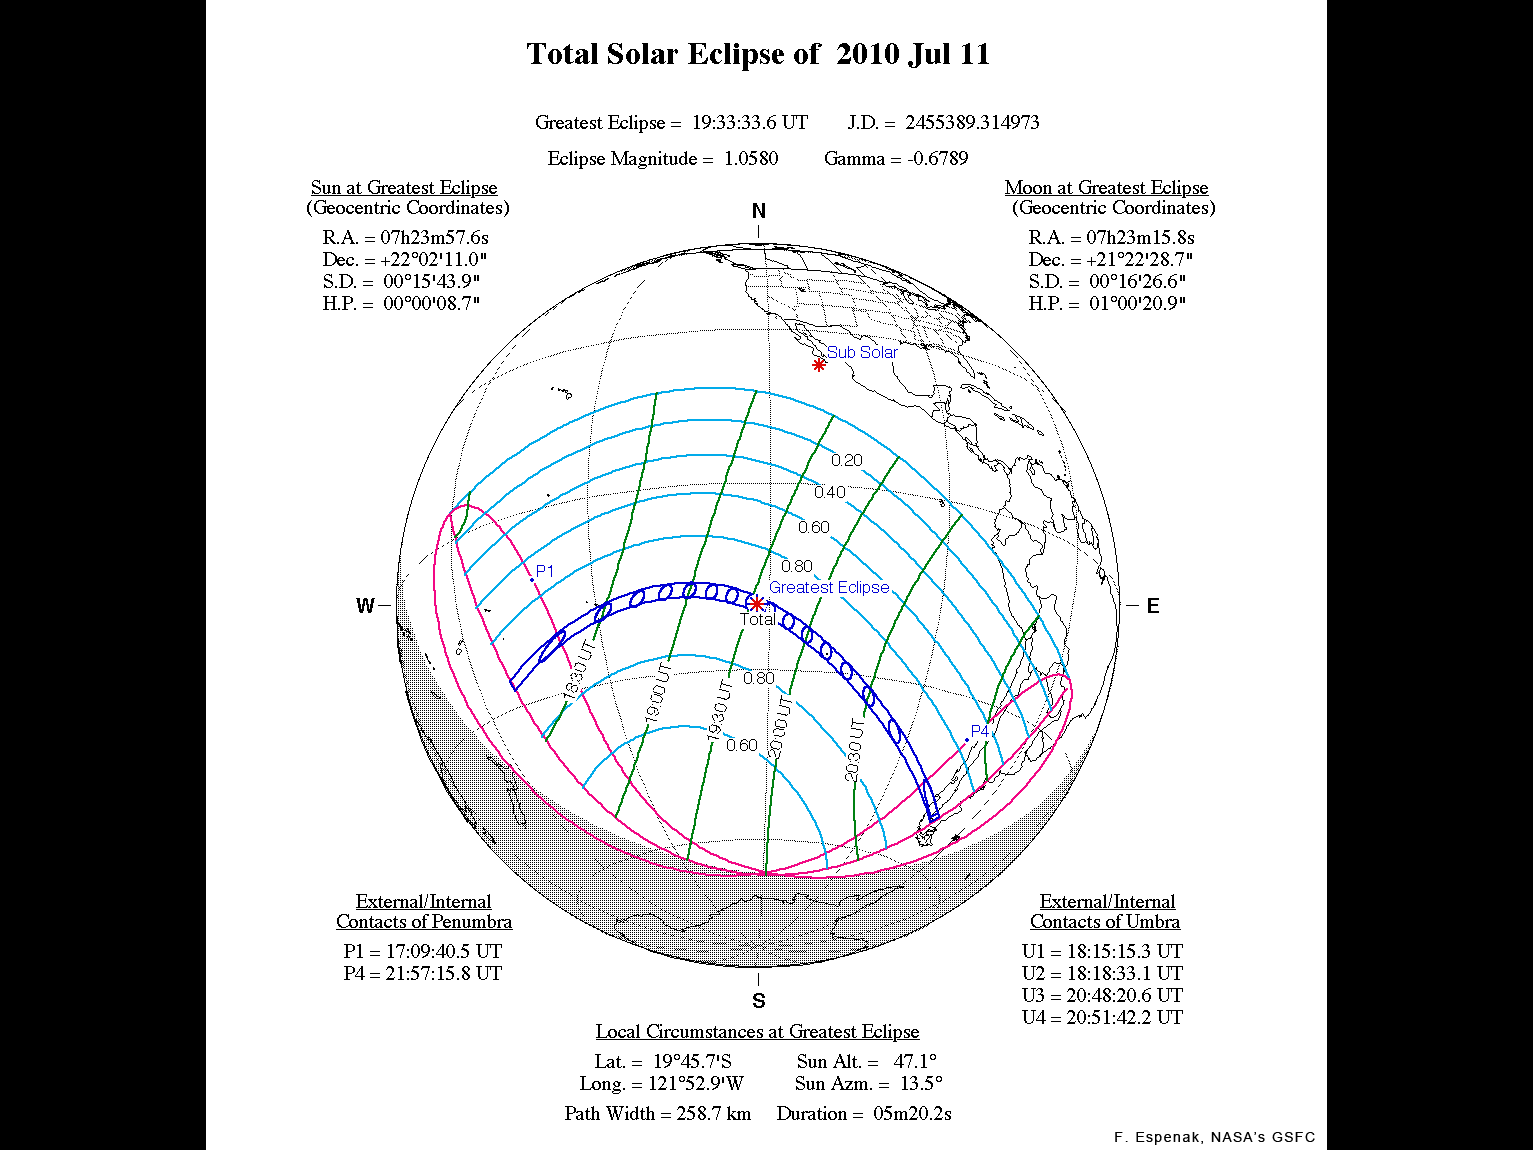
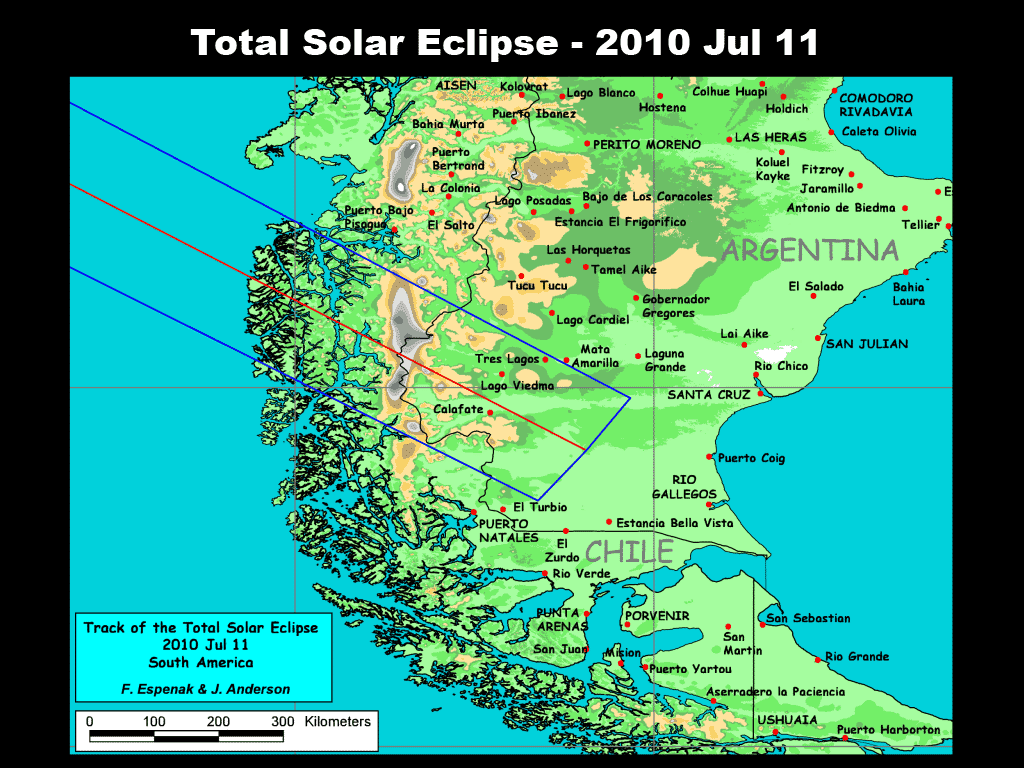
The second solar eclipse of 2010 occurs at the Moon's descending node in central Gemini just 45 arc-minutes east of the 3rd magnitude star Delta Geminorum. The path of the Moon's umbral shadow crosses the South Pacific Ocean where it makes no landfall except for Mangaia (Cook Islands), Easter Island (Isla de Pascua) and several isolated atolls. The path of totality ends just after reaching southern Chile and Argentina (Espenak and Anderson, 2008). The Moon's penumbral shadow produces a partial eclipse visible from a much larger region covering the South Pacific and southern South America (Figure 3).
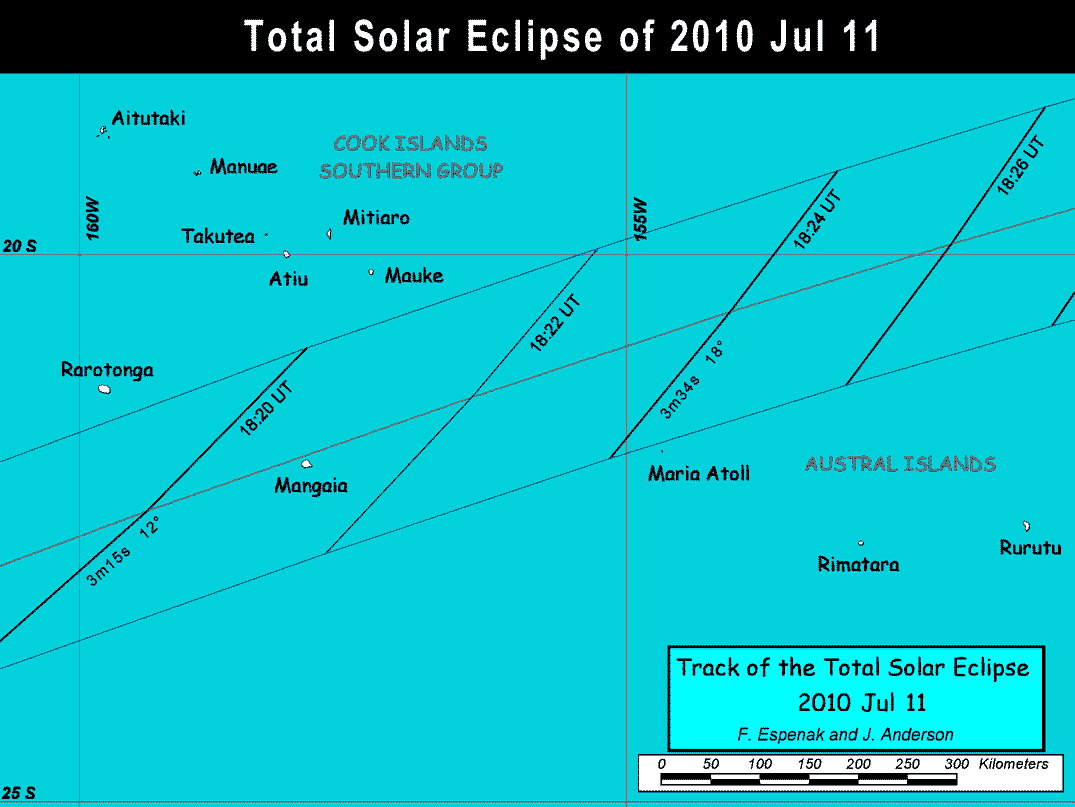
The central eclipse path begins in the South Pacific about 700 km southeast of Tonga at 18:15 UT. Traveling northeast, the track misses Rarotonga - the largest and most populous of the Cook Islands - by just 25 km. The first landfall occurs at Mangaia where the total eclipse lasts 3 minutes 18 seconds with the Sun 14° above the horizon.
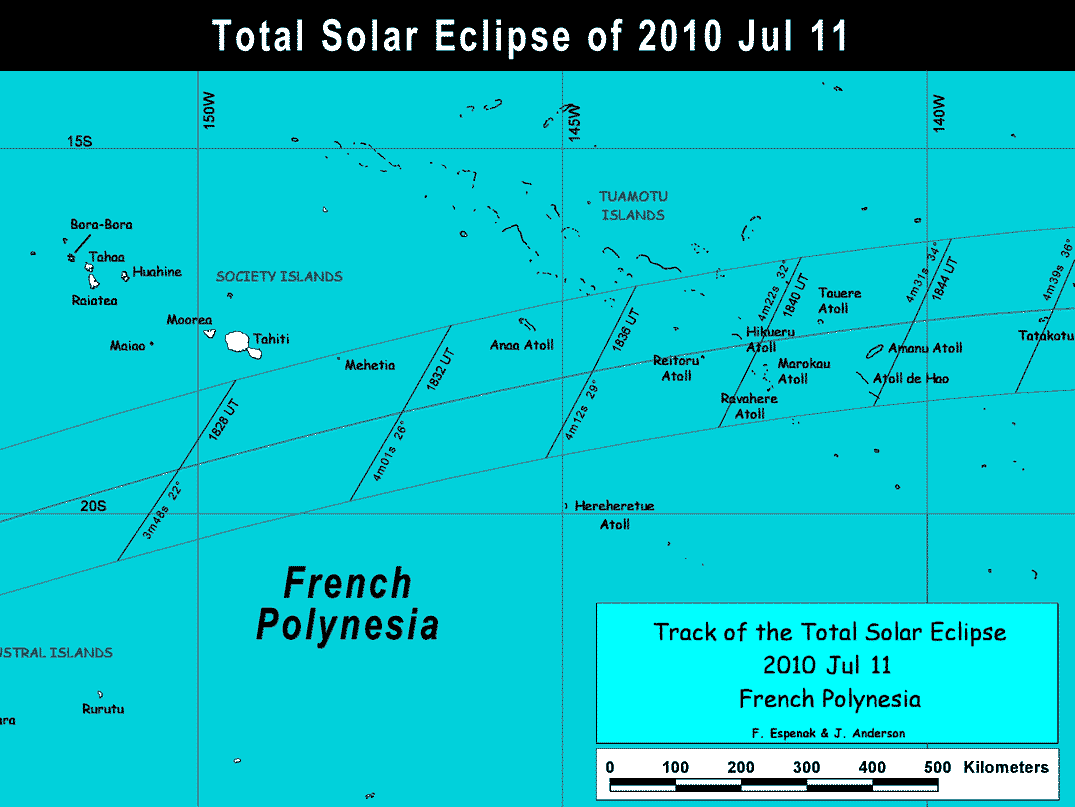
The southern coast line of French Polynesia's Tahiti lies a tantalizing 20 km north of the eclipse path and experiences a deep 0.996 magnitude partial eclipse at 18:28 UT. Several cruises are already scheduled to intercept the umbral shadow from Papeete.
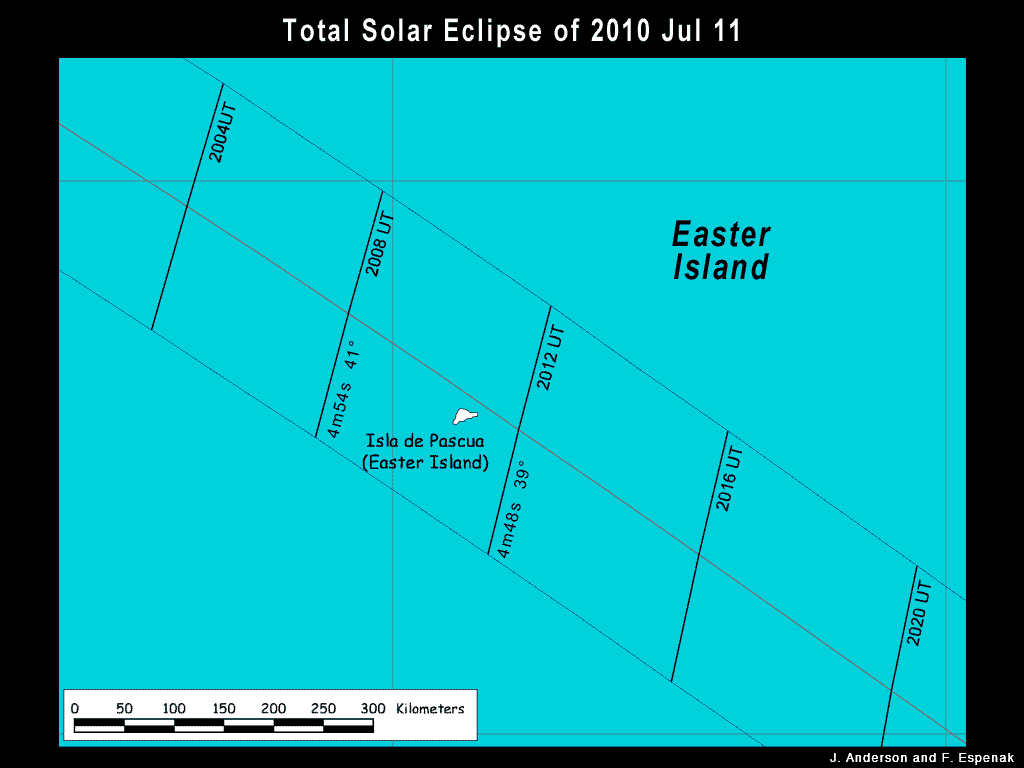
Greatest eclipse occurs in the South Pacific at 19:33:31 UT. At this instant, the axis of the Moon's shadow passes closest to Earth's center. The maximum duration of totality is 5 minutes 20 seconds, the Sun's altitude is 47°, and the path width is 259 km. Continuing across the vast Pacific, the umbral shadow's path encounters Easter Island, one of the most remote locations on Earth. From the capital, Hanga Roa, totality lasts 4 minutes 41 seconds with the Sun 40° above the horizon (20:11 UT). The 3,800 inhabitants of the isle are accustomed to tourism, but the eclipse is expected to bring record numbers to this unique destination.
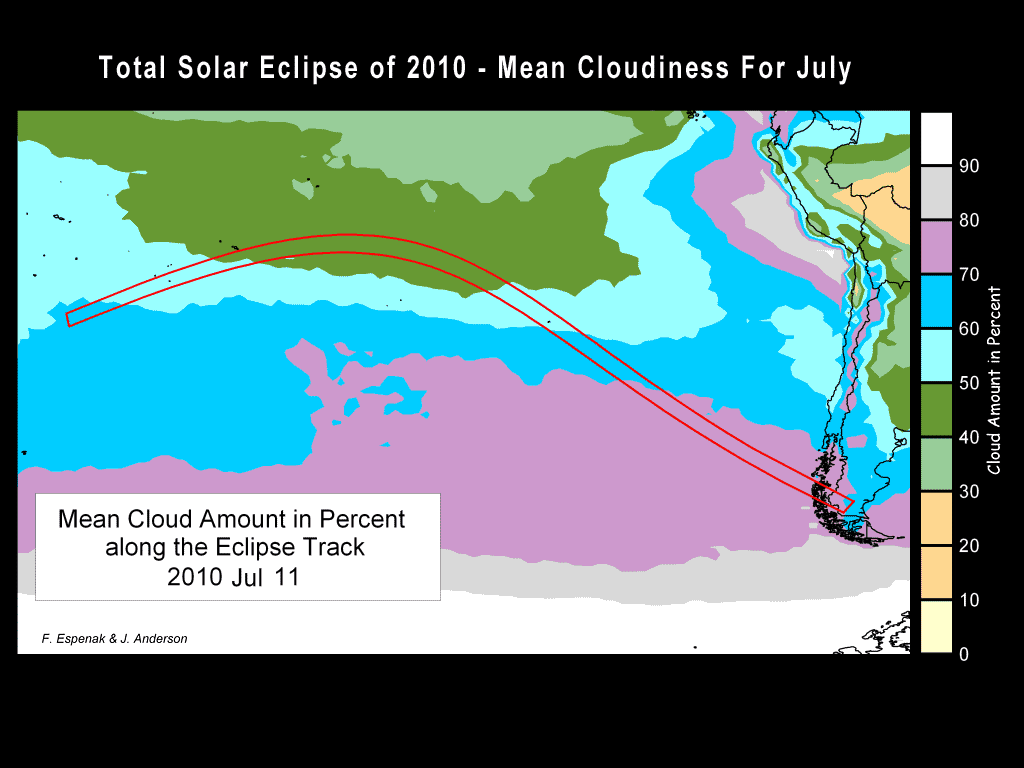
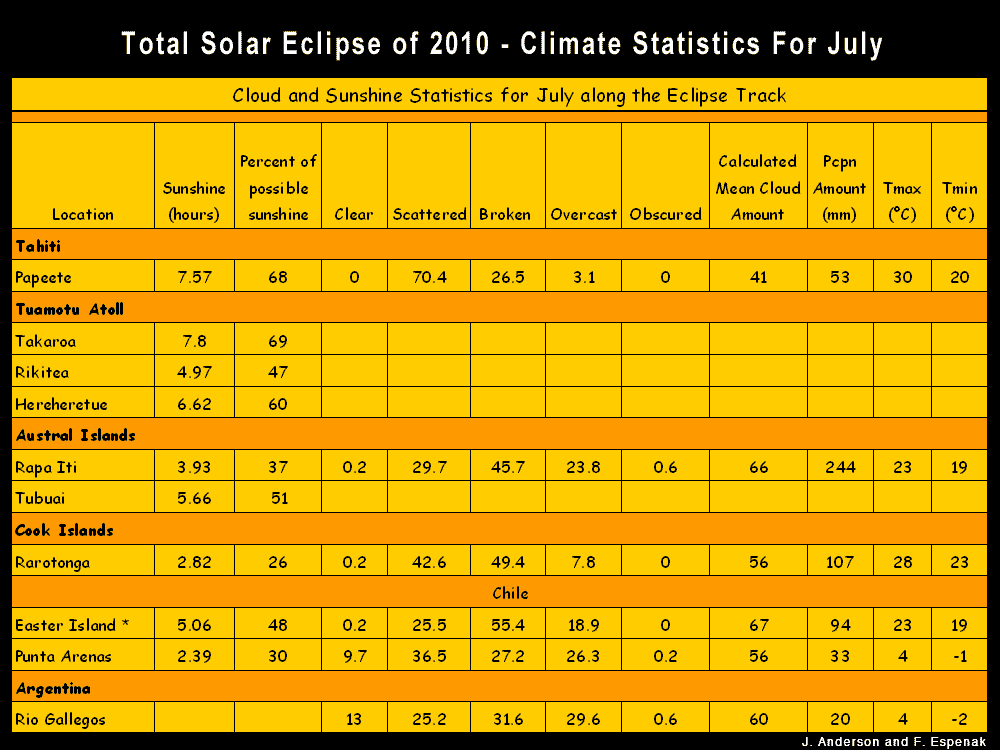
The Moon's shadow sweeps across another 3700 km of open ocean before beginning its final landfall along the rocky shores of southern Chile at 20:49 UT. The shadow is now an elongated ellipse and its increasing ground velocity brings with it a corresponding decrease in the duration of totality. It is mid-winter in the Andes so clouds and high mountain peaks threaten to block views of the total eclipse. Nevertheless some hearty eclipse observers will find Argentina's tourist village of El Calafate a prime destination for the eclipse. The Sun's altitude is only 1° during the 2 minute 47 second total phase, but the lake may offer an adequate line-of-site to the eclipse hanging just above the rugged Andes skyline.
The path ends in southern Argentina when the umbra slips off Earth's surface as it returns to space (20:52 UT). Over the course of 2 2/3 hours, the umbra travels along a track approximately 11,100 km long that covers 0.48% of Earth's surface area. It will be 29 months before the next total solar eclipse occurs on 2012 Nov 13.
Path coordinates and central line circumstances are presented in Table 4. Local circumstances for a number of cities are listed in Table 5. All times are given in Universal Time. The Sun's altitude and azimuth, the eclipse magnitude and obscuration are all given at the instant of maximum eclipse.
This is the 27th eclipse of Saros 146 (Espenak and Meeus, 2006). The series began on 1541 Sep 19 with the first of an unusually long series of 22 partial eclipses. The first central eclipse was total with a maximum duration of 4.1 minutes on 1938 May 29. Subsequent total eclipses in the series have seen an increase in the duration of totality. The 2010 eclipse marks the longest totality of Saros 146 because future durations will decrease. The series produces the first of 4 hybrid eclipses on 2172 Oct 17. The remaining 24 central eclipses of Saros 141 are all annular and span the period from 2244 Dec 01 to 2659 Aug 10. The series ends with a set of 13 partial eclipses the last of which occurs on 2893 Dec 29.
In all, Saros 146 produces 35 partial, 13 total, 4 hybrid and 24 annular eclipses. Complete details for the series can be found at:
eclipse.gsfc.nasa.gov/SEsaros/SEsaros146.html
Complete details including many tables, maps and weather prospects can be found in the NASA 2010 eclipse bulletin (Espenak and Anderson, 2008) and online at:
eclipse.gsfc.nasa.gov/SEmono/TSE2010/TSE2010.html
Finally, a web-based zoomable map of the 2010 total eclipse path is available plotted on Google maps at:
eclipse.gsfc.nasa.gov/SEgoogle/SEgoogle2001/SE2010Jul11Tgoogle.html
The last lunar eclipse of 2010 is especially well placed for observers throughout North America. The eclipse occurs at the Moon's descending node in eastern Taurus, four days before perigee.
The Moon's orbital trajectory takes it through the northern half of Earth's umbral shadow. Although the eclipse is not central, the total phase still lasts 72 minutes. The Moon's path through Earth's shadows as well as a map illustrating worldwide visibility of the event are shown in Figure 4. The timings of the major eclipse phases are listed below.
Penumbral Eclipse Begins:   05:29:17 UT
Partial Eclipse Begins:     06:32:37 UT
Total Eclipse Begins:       07:40:47 UT
Greatest Eclipse:           08:16:57 UT
Total Eclipse Ends:         08:53:08 UT
Partial Eclipse Ends:       10:01:20 UT
Penumbral Eclipse Ends:     11:04:31 UT
At the instant of greatest eclipse (08:17 UT) the Moon lies near the zenith for observers in southern California and Baja Mexico. At this time, the umbral magnitude peaks at 1.2561 as the Moon's southern limb passes 2.8 arc-minutes north of the shadow's central axis. In contrast, the Moon's northern limb lies 8.1 arc-minutes from the northern edge of the umbra and 34.6 arc-minutes from the shadow center. Thus, the southern half of the Moon will appear much darker than the northern half because it lies deeper in the umbra. Since the Moon samples a large range of umbral depths during totality, its appearance will change dramatically with time. It is not possible to predict the exact brightness distribution in the umbra, so observers are encouraged to estimate the Danjon value at different times during totality (see Danjon Scale of Lunar Eclipse Brightness). Note that it may also be necessary to assign different Danjon values to different portions of the Moon (i.e., north vs. south).
During totality, the winter constellations are well placed for viewing so a number of bright stars can be used for magnitude comparisons. Pollux (mv = +1.16) is 25° east of the eclipsed Moon, while Betelgeuse (mv = +0.45) is 16° to the south, Aldebaran (mv = +0.87) is 20° to the west, and Capella (mv = +0.08) is 24° to the north.
The entire event is visible from North America and western South America. Observers along South America's east coast miss the late stages of the eclipse because they occur after moonset. Likewise much of Europe and Africa experience moonset while the eclipse is in progress. Only northern Scandinavians can catch the entire event from Europe. For observers in eastern Asia the Moon rises in eclipse. None of the eclipse is visible from south and east Africa, the Middle East or South Asia.
Table 6 lists predicted umbral immersion and emersion times for 20 well-defined lunar craters. The timing of craters is useful in determining the atmospheric enlargement of Earth's shadow (see Crater Timings During Lunar Eclipses).
The December 21 total lunar eclipse belongs to Saros 125 a series of 72 eclipses in the following sequence: 17 penumbral, 13 partial, 26 total, 9 partial, and 7 penumbral lunar eclipses (Espenak and Meeus, 2009). Complete details for the series can be found at:
eclipse.gsfc.nasa.gov/LEsaros/LEsaros125.html
Eclipse Altitudes and Azimuths
The altitude a and azimuth A of the Sun or Moon during an eclipse depend on the time and the observer's geographic coordinates. They are calculated as follows:
h = 15 (GST + UT - α ) + λ
a = arcsin [sin δ sin φ + cos δ cos h cos φ]
A = arctan [-(cos δ sin h)/(sin δ cos φ - cos δ cos h sin φ)]

where

h = hour angle of Sun or Moon
a = altitude
A = azimuth
GST = Greenwich Sidereal Time at 0:00 UT
UT = Universal Time
α = right ascension of Sun or Moon
δ = declination of Sun or Moon
λ = observer's longitude (east +, west -)
φ = observer's latitude (north +, south -)
During the eclipses of 2010, the values for GST and the geocentric Right Ascension and Declination of the Sun or the Moon (at greatest eclipse) are as follows:
Eclipse             Date          GST         α         δ

Annular Solar    2010 Jan 15     7.642      19.797    -21.127
Partial Lunar    2010 Jun 26    18.299      18.353    -24.002
Total Solar      2010 Jul 11    19.307       7.399     22.036
Total Lunar      2010 Dec 21     5.986       5.955     23.746
Two web based tools that can also be used to calculate the local circumstances for all solar and lunar eclipses visible from any location. They are the Javascript Solar Eclipse Explorer and the Javascript Lunar Eclipse Explorer. The URLs for these tools are:
Javascript Solar Eclipse Explorer: eclipse.gsfc.nasa.gov/JSEX/JSEX-index.html
Javascript Lunar Eclipse Explorer: eclipse.gsfc.nasa.gov/JLEX/JLEX-index.html
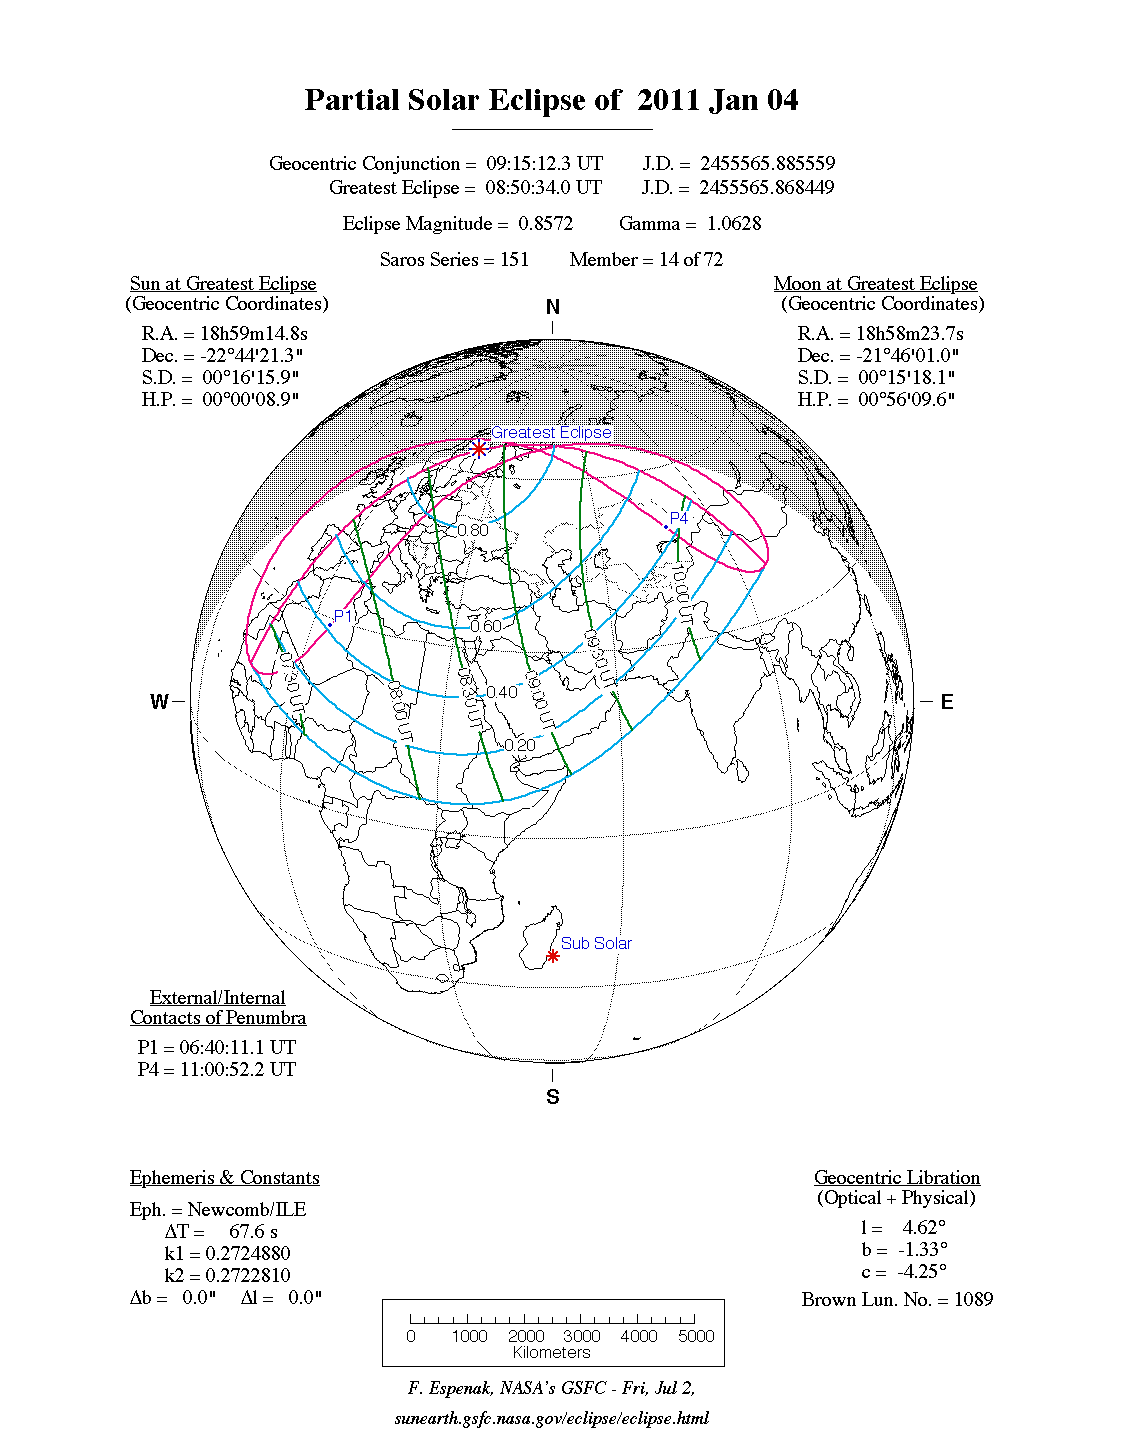
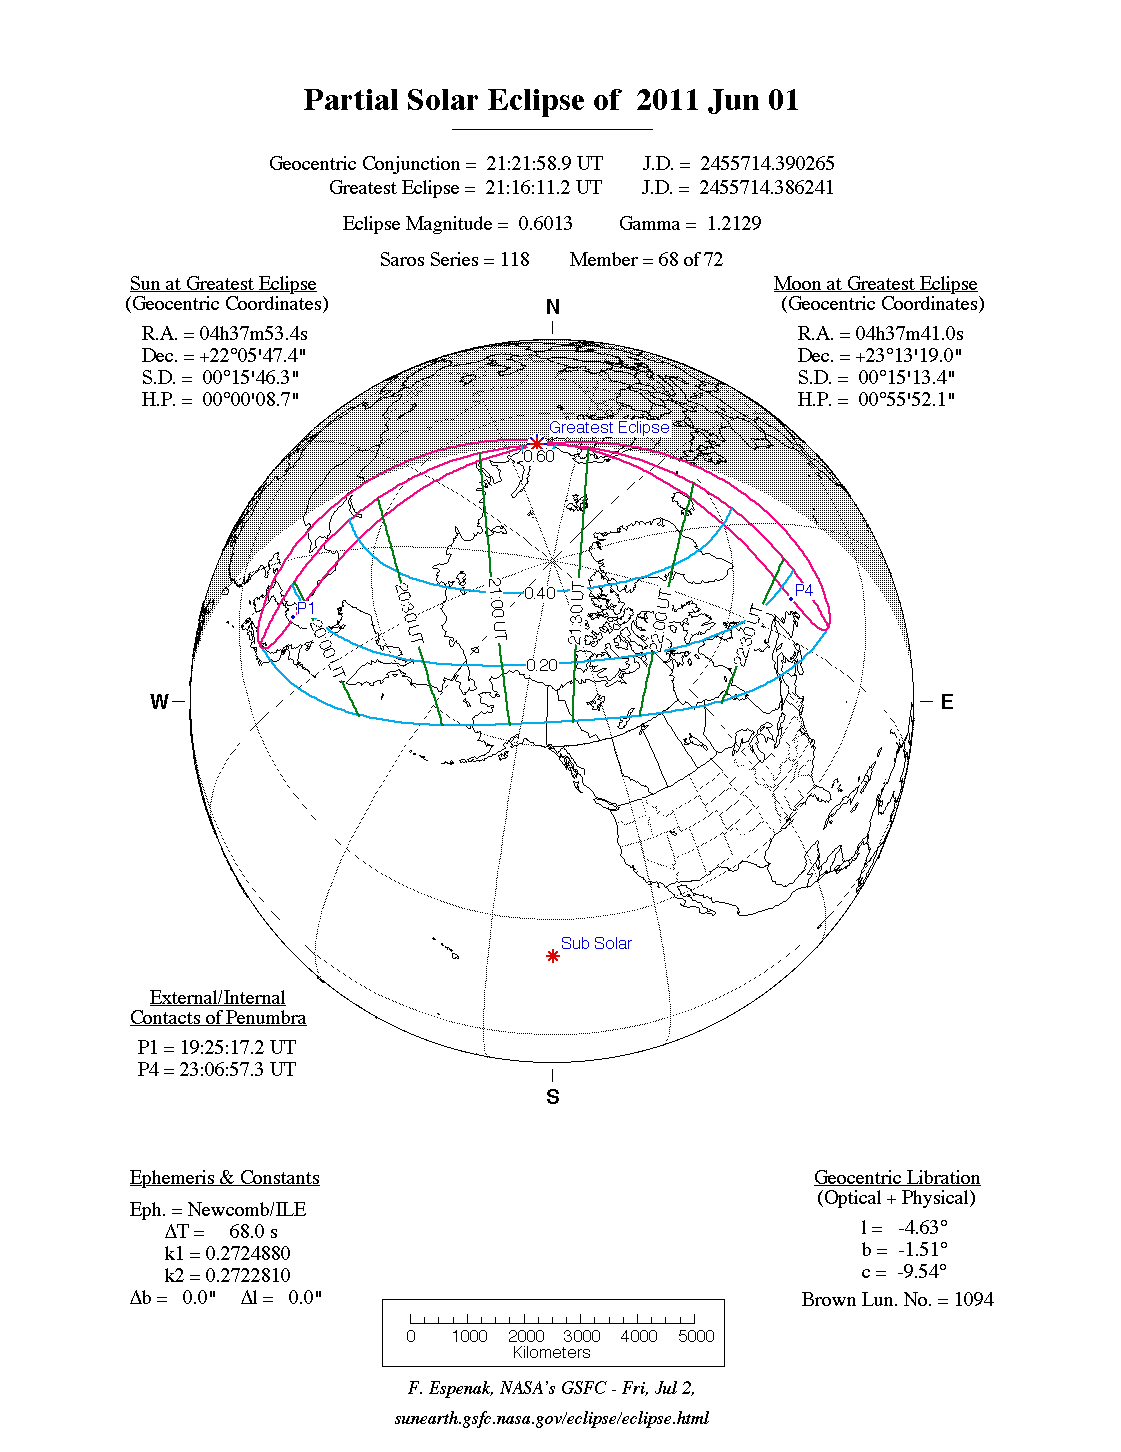
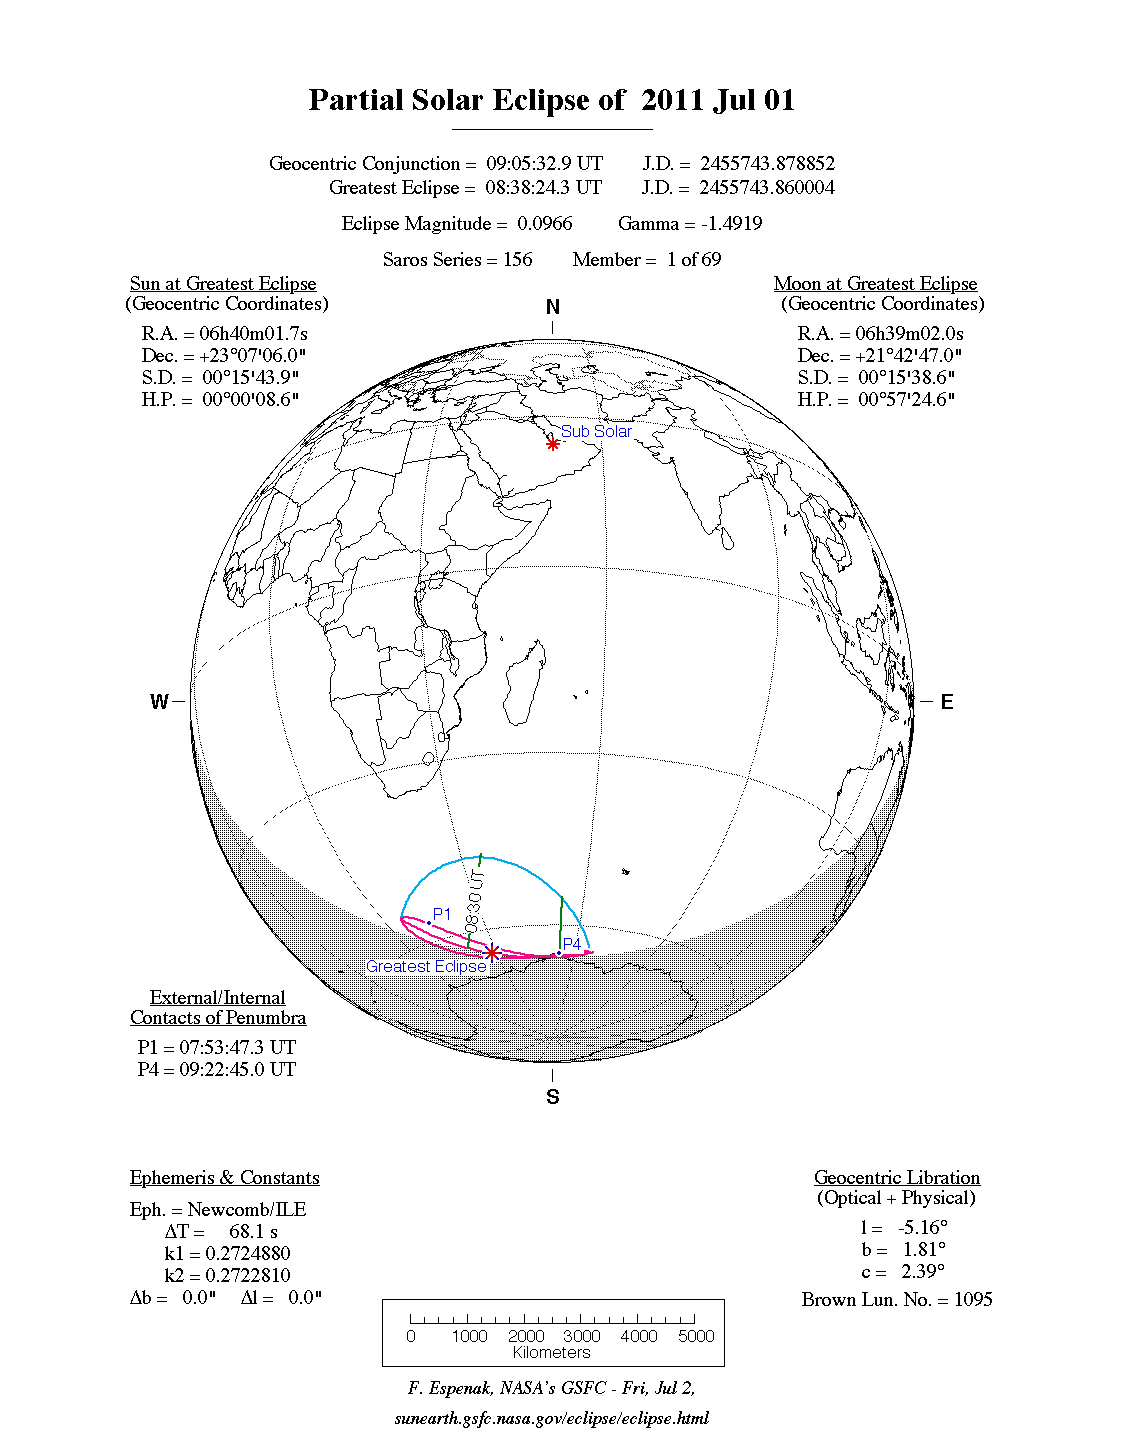
Eclipses During 2011
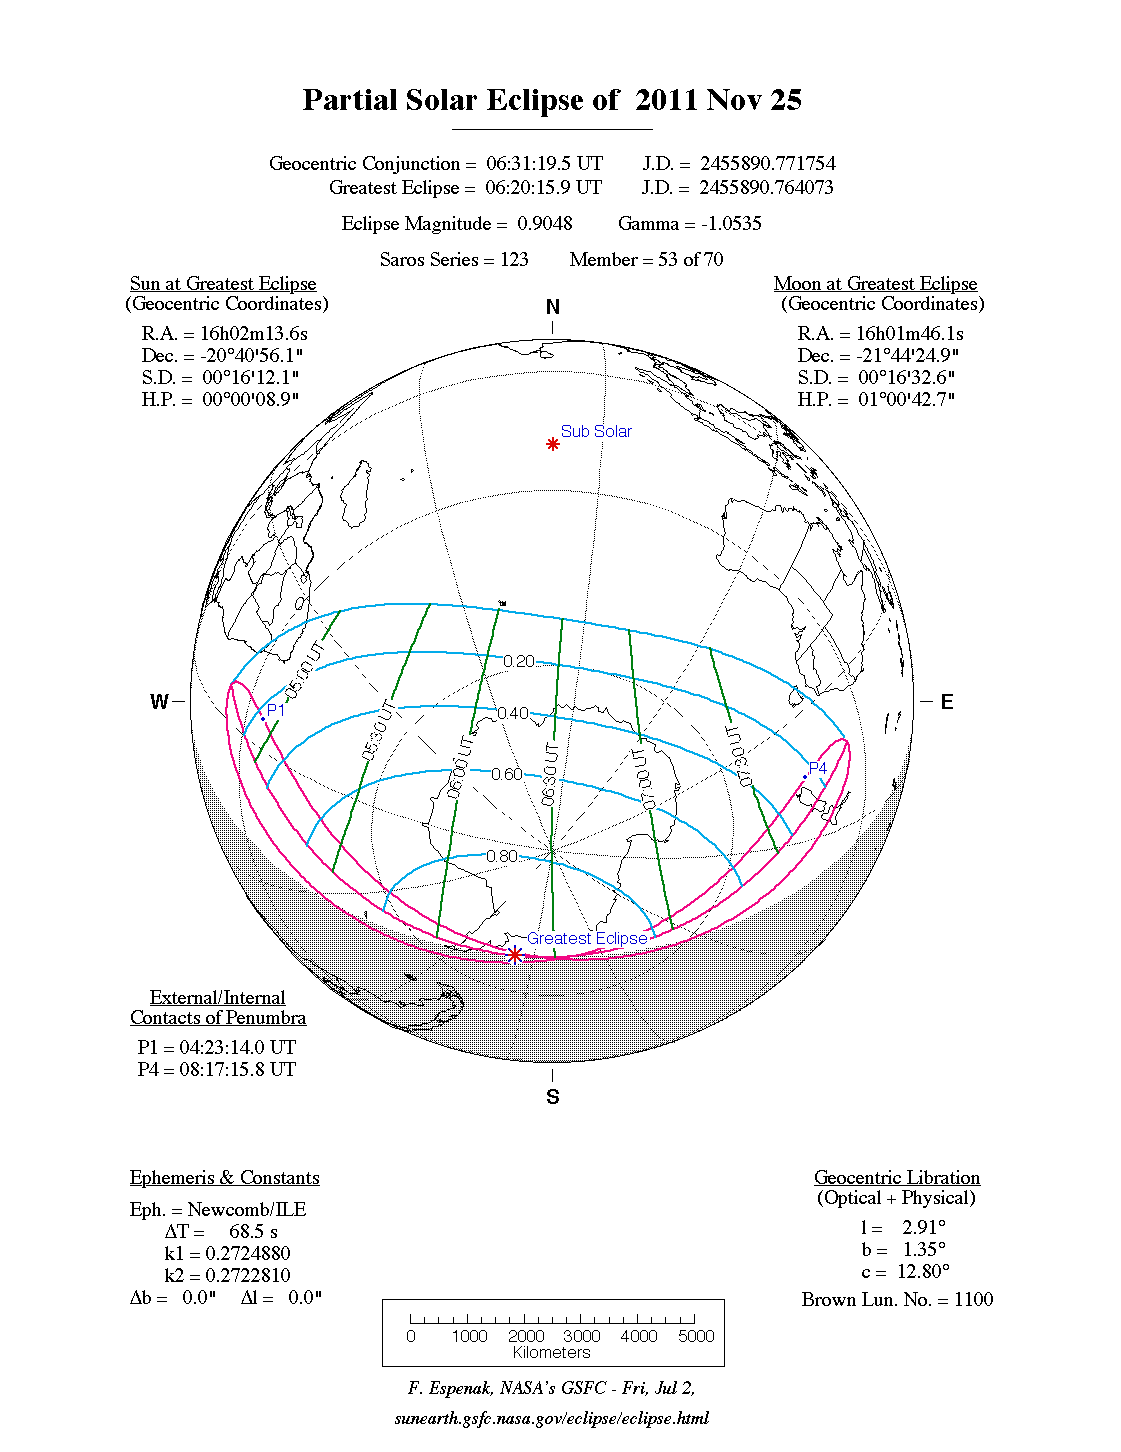
During 2011, there will be four partial solar eclipses and two total lunar eclipses:
A full report on eclipses during 2011 will be published in Observer's Handbook 2011.
NASA Solar Eclipse Bulletins
Special bulletins containing detailed predictions and meteorological data for future solar eclipses of interest are prepared by Fred Espenak and Jay Anderson and are published through NASA's Publication series. The bulletins are provided as a public service to both the professional and lay communities, including educators and the media. A list of currently available bulletins and an order form can be found at:
eclipse.gsfc.nasa.gov/SEpubs/RPrequest.html
The most recent bulletin of the series covers the annular and total solar eclipses of 2010. Single copies of the eclipse bulletins are available at no cost by sending a 9 x 12-in. self-addressed envelope stamped with postage for 11 oz. (310 g). Please print the eclipse year on the envelope's lower left corner. Use stamps only, since cash and cheques cannot be accepted. Requests from outside the United States and Canada may include 10 international postal coupons. Mail requests to: Fred Espenak, NASA's Goddard Space Flight Center, Code 693, Greenbelt MD 20771, USA.
The NASA eclipse bulletins are also available over the Internet, including out-of-print bulletins. They can be read or downloaded from the NASA Eclipse Web Site at:
eclipse.gsfc.nasa.gov/SEpubs/bulletin.html
Eclipse Web Sites
The URL of the NASA Eclipse Web Site is:
eclipse.gsfc.nasa.gov/eclipse.html
The site features predictions and maps for all solar and lunar eclipses well into the 21st century, with special emphasis on upcoming eclipses. Special pages are devoted to the total solar eclipses of 2008, 2009 and 2010 that feature detailed maps, tables, graphs, and meteorological data. A world atlas of solar eclipses provides maps of all central eclipse paths from 2000 BCE to 3000 CE. The entire Five Millenium Canon of Solar Eclipses [Espenak and Meeus, 2006] can be downloaded in PDF format and all maps are also available online as individual GIFs of PSFs. Additional catalogues list every solar and lunar eclipse over a 5000-year period.
Detailed information on solar and lunar eclipse photography and tips on eclipse observing and eye safety may be found at:
www.mreclipse.com
Acknowledgments
All eclipse predictions were generated on an Apple G4 iMac computer using algorithms developed from the Explanatory Supplement [1974] with additional algorithms from Meeus, Grosjean, and Vanderleen [1966]. The solar coordinates used in the eclipse predictions are based on VSOP87 [P. Bretagnon and G. Francou, 1988]. The lunar coordinates are based on ELP-2000/82 [M. Chapront-Touzé and J. Chapront, 1983]. For lunar eclipses, the diameter of the umbral and penumbral shadows were calculated using Danjon's rule of enlarging Earth's radius by 1/85 to compensate for the opacity of the terrestrial atmosphere; corrections for the effects of oblateness have also been included. Text and table composition was done on a Macintosh using Microsoft Word. Additional figure annotation was performed with Claris MacDraw Pro.
All calculations, diagrams, tables, and opinions presented in this paper are those of the author, and he assumes full responsibility for their accuracy.
Footnotes
[1] The instant of greatest eclipse occurs when the distance between the Moon's shadow axis and Earth's geocenter reaches a minimum.
[2] Eclipse magnitude is defined as the fraction of the Sun's diameter occulted by the Moon
[3] The sub-solar point is the geographic location where the Sun appears directly overhead (zenith).
References
Bretagnon P., Francou G., "Planetary Theories in rectangular and spherical variables: VSOP87 solution", Astron. and Astrophys., vol. 202, no. 309 (1988).
Chapront-Touzé, M and Chapront, J., "The Lunar Ephemeris ELP 2000," Astron. and Astrophys., vol. 124, no. 1, pp 50-62 (1983).
Chauvenet, W., Manual of Spherical and Practical Astronomy, Vol.1, 1891 (Dover edition 1961).
Danjon, A., "Les éclipses de Lune par la pénombre en 1951," L'Astronomie, 65, 51-53 (Feb. 1951).
Espenak, F., Fifty Year Canon of Solar Eclipses: 1986–2035, Sky Publishing Corp., Cambridge, MA, 1988.
Espenak, F., Fifty Year Canon of Lunar Eclipses: 1986–2035, Sky Publishing Corp., Cambridge, MA, 1989.
Espenak, F., and Anderson, J., Annular and Total Solar Eclipses of 2010, NASA TP–2008-214171, Goddard Space Flight Center, Greenbelt, MD, 2008.–
Espenak, F., and Meeus, J., Five Millennium Canon of Solar Eclipses: –2000 to +3000 (2000 BCE to 3000 CE), NASA TP–2006-214141, Goddard Space Flight Center, Greenbelt, MD, 2006.
Espenak, F., and Meeus, J., Five Millennium Canon of Lunar Eclipses: –2000 to +3000 (2000 BCE to 3000 CE), NASA TP–2009-214172, Goddard Space Flight Center, Greenbelt, MD, 2006.
Explanatory Supplement to the Astronomical Ephemeris and the American Ephemeris and Nautical Almanac, Her Majesty's Nautical Almanac Office, London, 1974.
Littmann, M., Espenak, F., & Willcox, K., Totality—Eclipses of the Sun, 3rd Ed., Oxford University Press, New York, 2008.
Meeus, J., Grosjean, C.C., & Vanderleen, W., Canon of Solar Eclipses, Pergamon Press, New York, 1966.
Meeus, J. & Mucke, H., Canon of Lunar Eclipses: -2002 to +2526, Astronomisches Buro, Wien, 1979.




 3:35 AM
 Nasa Information
, Posted in
Nasa Information
, Posted in


 "Still from video detailing SDO's EVE instrument")
 The extreme ultraviolet (EUV) sun imaged by the Solar and Heliospheric Observatory (SOHO) over one complete solar cycle. The sun changes more at EUV wavelengths than it does in any other part of the electromagnetic spectrum. Credit: NASA/SOHO
 The Extreme Ultraviolet Variability Experiment (EVE) has four primary sensors. MEGS-A and -B are the Multiple UV Grating Spectrographs; ESP is the EUV Spectrophotometer; SAMS is the Solar Aspect Monitor. Credit: NASA